
00:00:00
使用loki和grafana展示ingress-nginx的日志 原创
基于 kubernetes 为容器平台的业种中, 对于日志的收集,使用最多的是 FEK, 不过有时候,FEK 在架构上会略显重, ES 的查询及全文检索功能其实使用的不是很多,LoKi 做为日志架构的新面孔, 由 grafana 开源, 使用了与 Prometheus 同样的 label 理念, 同时摒弃了全文检索的能力, 因此比较轻便, 非常具有潜力。
like Prometheus, but for logs
Loki是 Grafana Labs 团队最新的开源项目,是一个水平可扩展,高可用性,多租户的日志聚合系统。它的设计非常经济高效且易于操作,因为它不会为日志内容编制索引,而是为每个日志流编制一组标签。项目受 Prometheus 启发,官方的介绍就是:Like Prometheus, but for logs,类似于 Prometheus 的日志系统
与其他日志聚合系统相比,Loki具有下面的一些特性:
- 不对日志进行全文索引。通过存储压缩非结构化日志和仅索引元数据,Loki 操作起来会更简单,更省成本。
- 通过使用与 Prometheus 相同的标签记录流对日志进行索引和分组,这使得日志的扩展和操作效率更高。
- 特别适合储存 Kubernetes Pod 日志; 诸如 Pod 标签之类的元数据会被自动删除和编入索引。
- 受 Grafana 原生支持。
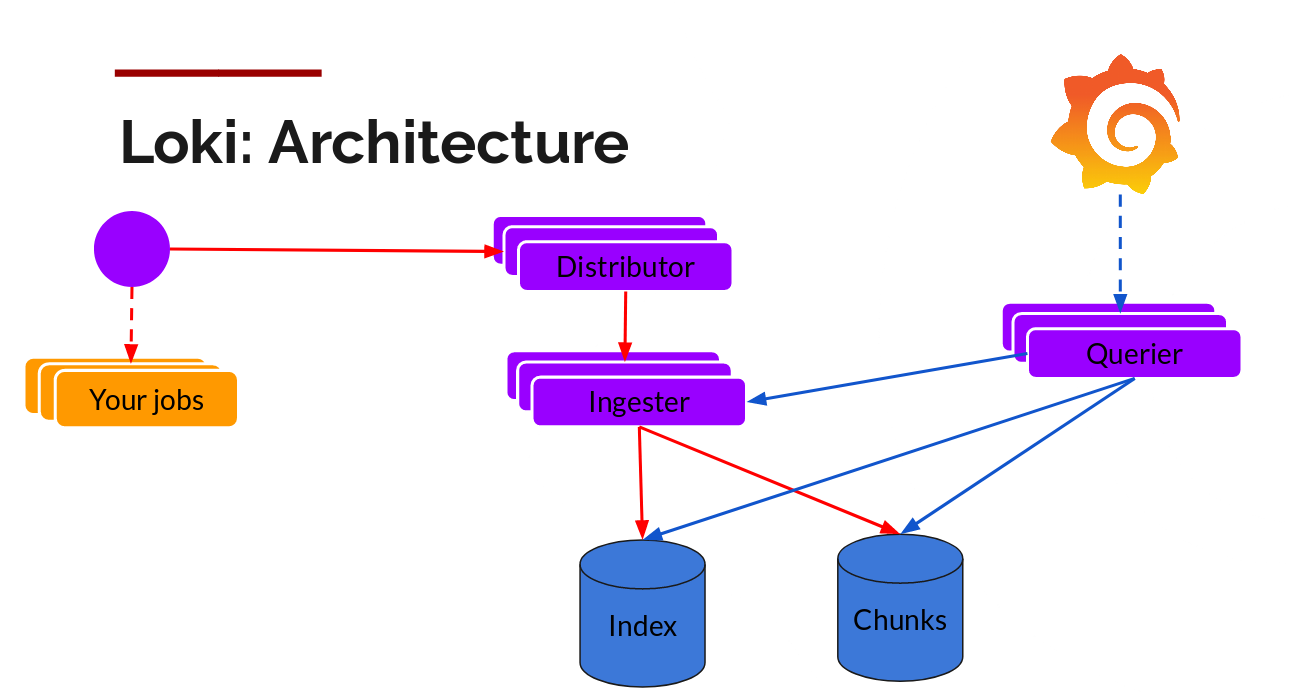
Loki 由以下 3 个部分组成:
loki是主服务器,负责存储日志和处理查询。promtail是代理,负责收集日志并将其发送给 loki,当然也支持其它的收集端如 fluentd 等Grafana用于 UI 展示
同时 Loki 也提示了 command line 工具,通过这个工具可以使用 http 的方式与 loki 进行交互。
架构
安装
官方提供了多种的部署方式, 这里选择使用helm, 如果只是想试用的话则非常简单, 直接参考helm即可 run 起来。
shell
helm repo add loki https://grafana.github.io/loki/charts

helm repo update

helm upgrade --install loki loki/loki-stack我这里为了方便配置,就将其下载下来了,使用如下命令
shell
helm pull loki/loki-stack

tar xf loki-stack-2.1.2.tgz

helm install loki loki-stack/配置 Nginx-Ingress
这里将 NG 的日志落盘,便与处理。
(1)、修改 ConfigMap,如下:
yaml
# Source: ingress-nginx/templates/controller-configmap.yaml

apiVersion: v1

kind: ConfigMap

metadata:

  labels:

    helm.sh/chart: ingress-nginx-2.0.3

    app.kubernetes.io/name: ingress-nginx

    app.kubernetes.io/instance: ingress-nginx

    app.kubernetes.io/version: 0.32.0

    app.kubernetes.io/managed-by: Helm

    app.kubernetes.io/component: controller

  name: ingress-nginx-controller

  namespace: ingress-nginx

data:

  compute-full-forwarded-for: 'true'

  enable-underscores-in-headers: 'true'

  client_max_body_size: "100m"

  proxy_body_size: "100m"

  access-log-path: /var/log/nginx/access.log

  log-format-escape-json: "true"

  log-format-upstream: '{"timestamp": "$time_iso8601", "requestID": "$req_id", "proxyUpstreamName":

    "$proxy_upstream_name","host": "$host","body_bytes_sent": "$body_bytes_sent","proxyAlternativeUpstreamName": "$proxy_alternative_upstream_name","upstreamStatus":

    "$upstream_status", "geoip_country_code": "$geoip_country_code","upstreamAddr": "$upstream_addr","request_time":

    "$request_time","httpRequest":{"requestMethod": "$request_method", "requestUrl":

    "$request_uri", "status": $status,"requestSize": "$request_length", "responseSize":

    "$upstream_response_length", "userAgent": "$http_user_agent", "remoteIp": "$remote_addr",

"referer": "$http_referer", "latency": "$upstream_response_time", "protocol":"$server_protocol"}}'(2)修改 NG 的 deployment,主要增加如下配置
yaml
# Source: ingress-nginx/templates/controller-deployment.yaml

apiVersion: apps/v1

kind: Deployment

metadata:

  labels:

    helm.sh/chart: ingress-nginx-2.0.3

    app.kubernetes.io/name: ingress-nginx

    app.kubernetes.io/instance: ingress-nginx

    app.kubernetes.io/version: 0.32.0

    app.kubernetes.io/managed-by: Helm

    app.kubernetes.io/component: controller

  name: ingress-nginx-controller

  namespace: ingress-nginx

spec:

......

      initContainers:

      - name: adddirperm

        image: busybox

        command:

        - /bin/sh

        - -c

        - chown -R ${USER_ID}:${USER_ID} ${LOG_DIR}

        env:

        - name: LOG_DIR

          value: /var/log/nginx

        - name: USER_ID

          value: "101"

        volumeMounts:

        - name: logdir

          mountPath: /var/log/nginx

      containers:

        - name: controller

          image: quay.io/kubernetes-ingress-controller/nginx-ingress-controller:0.32.0

          imagePullPolicy: IfNotPresent

          lifecycle:

            preStop:

              exec:

                command:

                  - /wait-shutdown

          args:

            - /nginx-ingress-controller

            - --publish-service=ingress-nginx/ingress-nginx-controller

            - --election-id=ingress-controller-leader

            - --ingress-class=nginx

            - --configmap=ingress-nginx/ingress-nginx-controller

            - --validating-webhook=:8443

            - --validating-webhook-certificate=/usr/local/certificates/cert

            - --validating-webhook-key=/usr/local/certificates/key

            - --log_dir=/var/log/nginx

            - --logtostderr=false

......

          volumeMounts:

            - name: webhook-cert

              mountPath: /usr/local/certificates/

              readOnly: true

            - name: logdir

              mountPath: /var/log/nginx

          resources:

            requests:

              cpu: 100m

              memory: 90Mi

      serviceAccountName: ingress-nginx

      terminationGracePeriodSeconds: 300

      volumes:

......

        - name: logdir

          hostPath:

            path: /var/log/nginx

type: DirectoryOrCreate重新创建后即可在本地的/var/log/nginx 下查找到日志。
配置 promtail 收集日志
在 chart 根目录下的 value.yaml,将 promtail 模块修改如下:
yaml
promtail:

  enabled: true

  nodeSelector:

    kubernetes.io/hostname: "k8s-master-134"

  volumeMounts:

  - name: nginx

    mountPath: /var/log/nginx

    readOnly: true

  volumes:

  - name: nginx

    hostPath:

      path: /var/log/nginx

  scrapeConfigs:

  - job_name: kubernetes-nginx-ingress

    static_configs:

    - targets:

        - localhost

      labels:

        job: nginx_access_log

        app: ingress-nginx

__path__: /var/log/nginx/*.log其中:
- nodeSelector 是 nginx-ingress 所在的主机,只收集 nginx-ingress 日志,所以使用了强制调度
- volumeMounts 是挂载到 promtail pod 里的目录
- volumes 是主机节点持久化的目录
- scrapeConfigs 是抓取的配置,和 prometheus 很像
然后重新更新 loki 的 chart。
yaml
helm upgrade loki loki-stack/配置 Grafana
Grafana 搭建过程这里就不说了,loki 的 chart 包里可以直接搭建,也可以单独搭建。
注意:Grafana 版本要高于 6.6,不然有些图表无法显示。
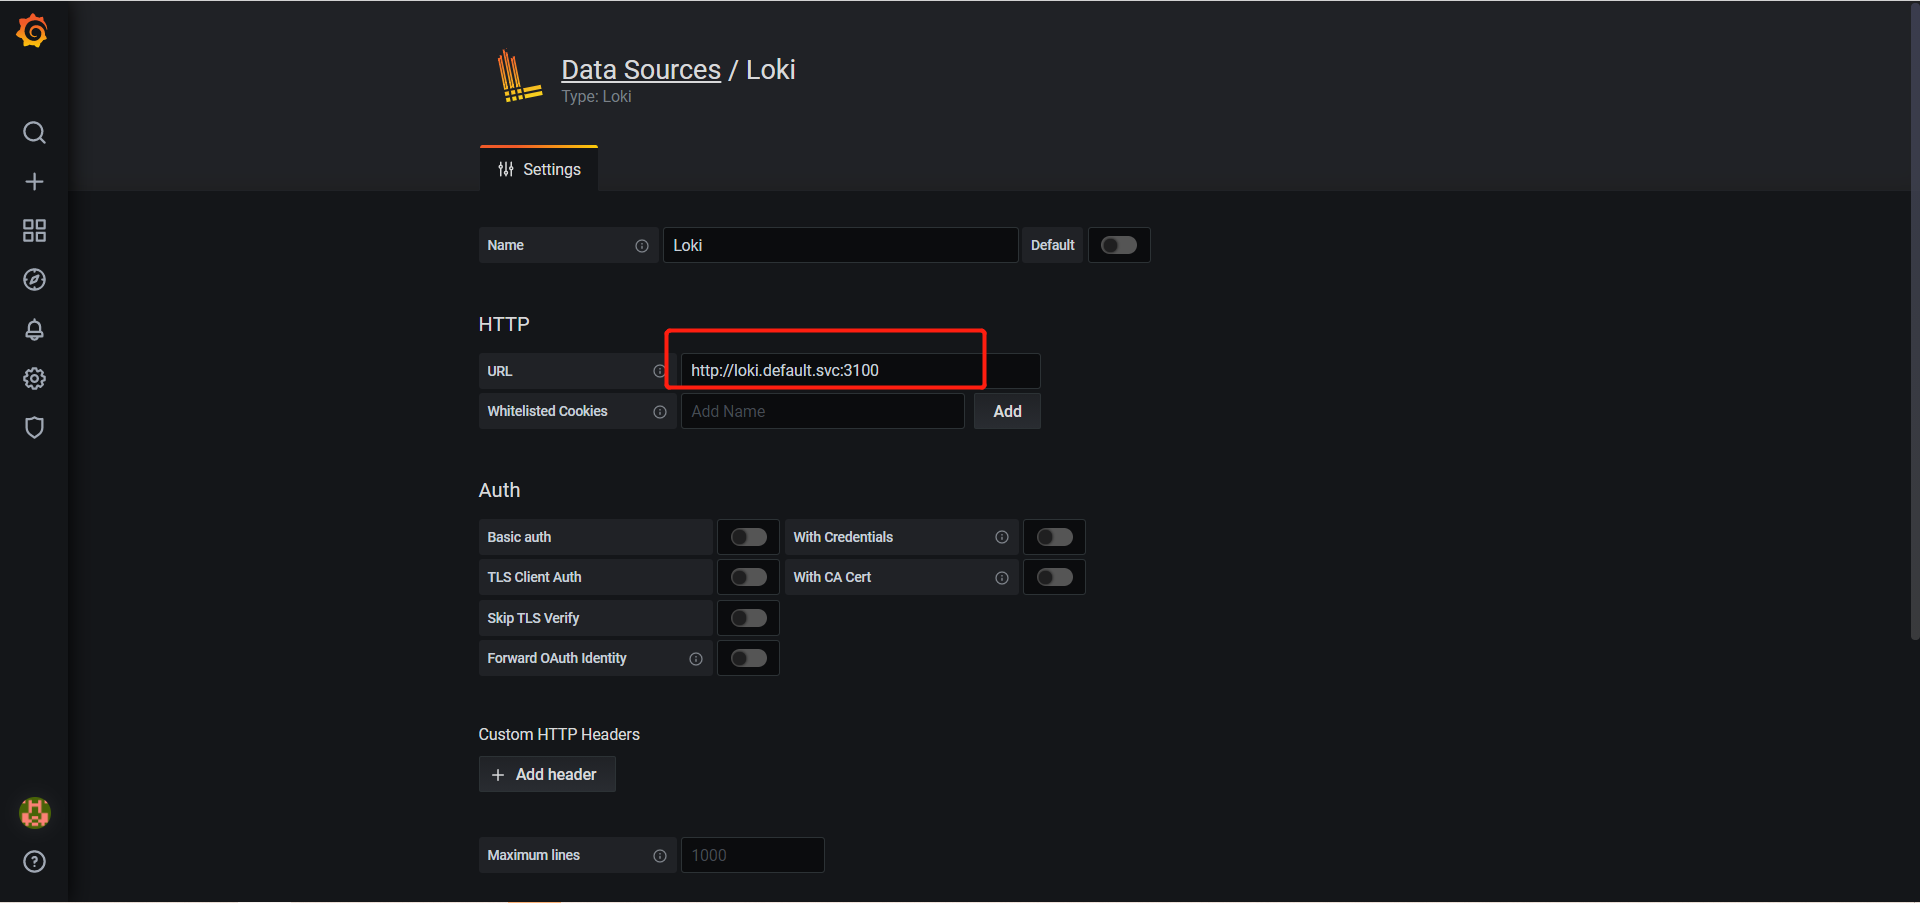
(1)添加数据源
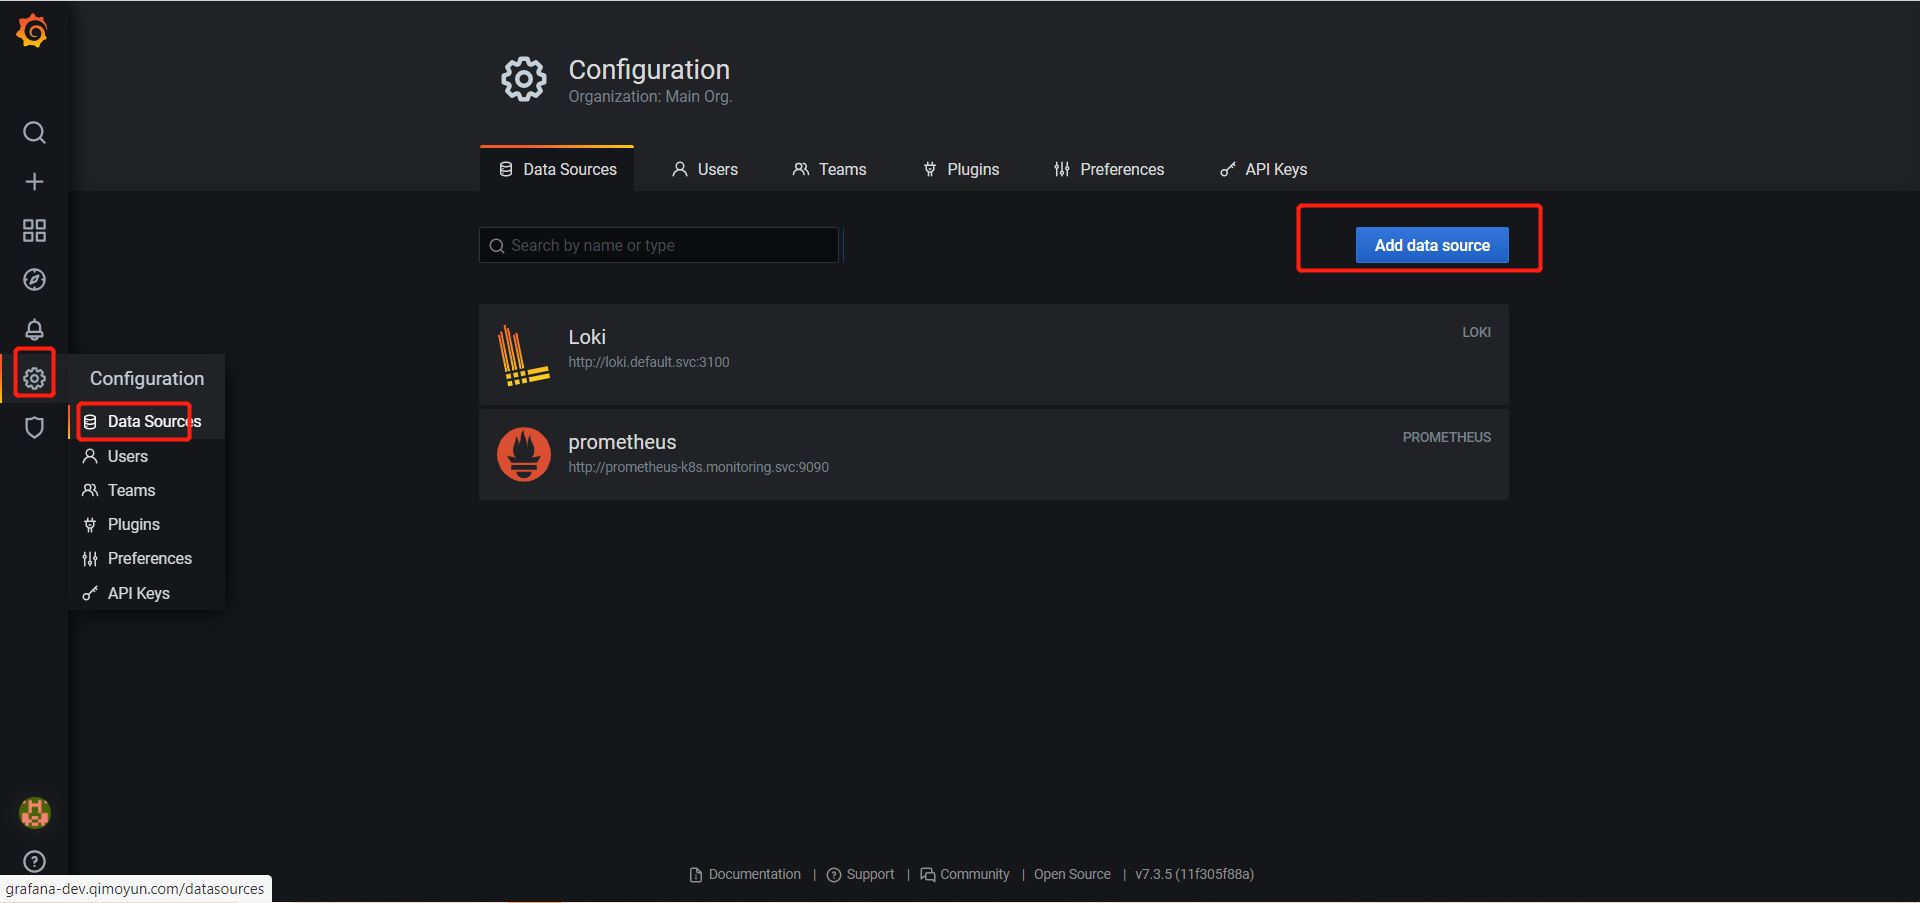
选择 loki,配置 URL,URL 根据实际部署的情况填写
(2)在 Explore 界面查看是否收到日志
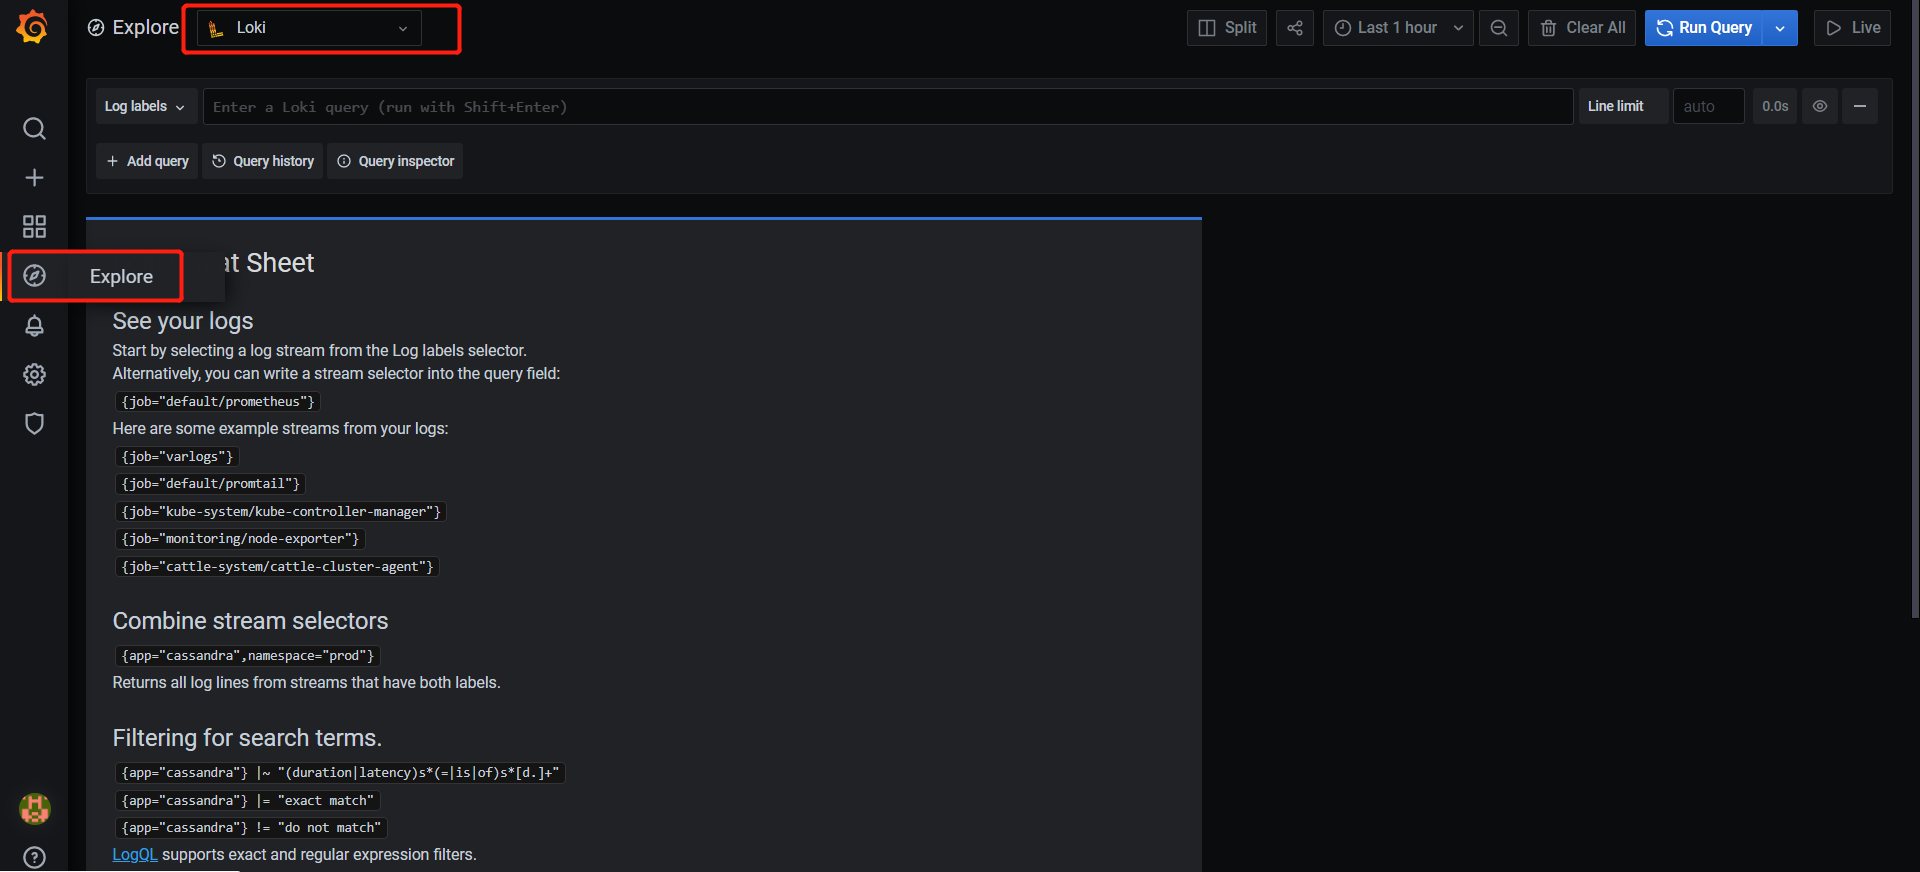
查看是否有对应的 app,如下
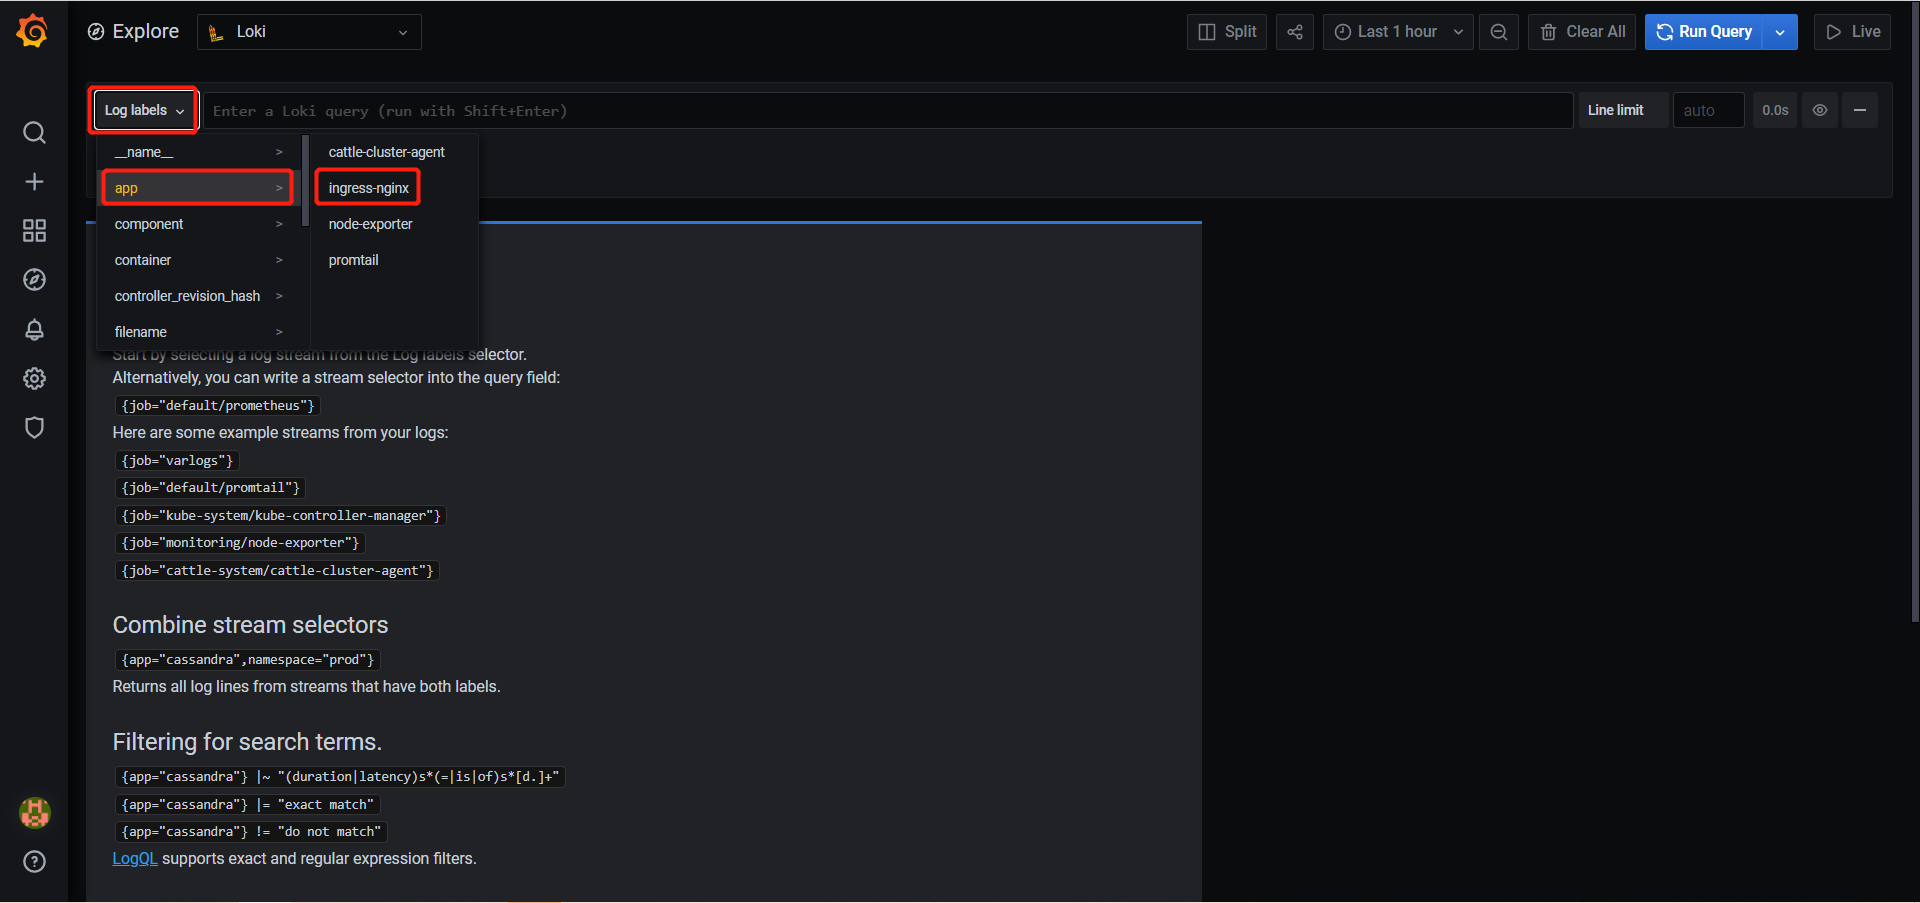
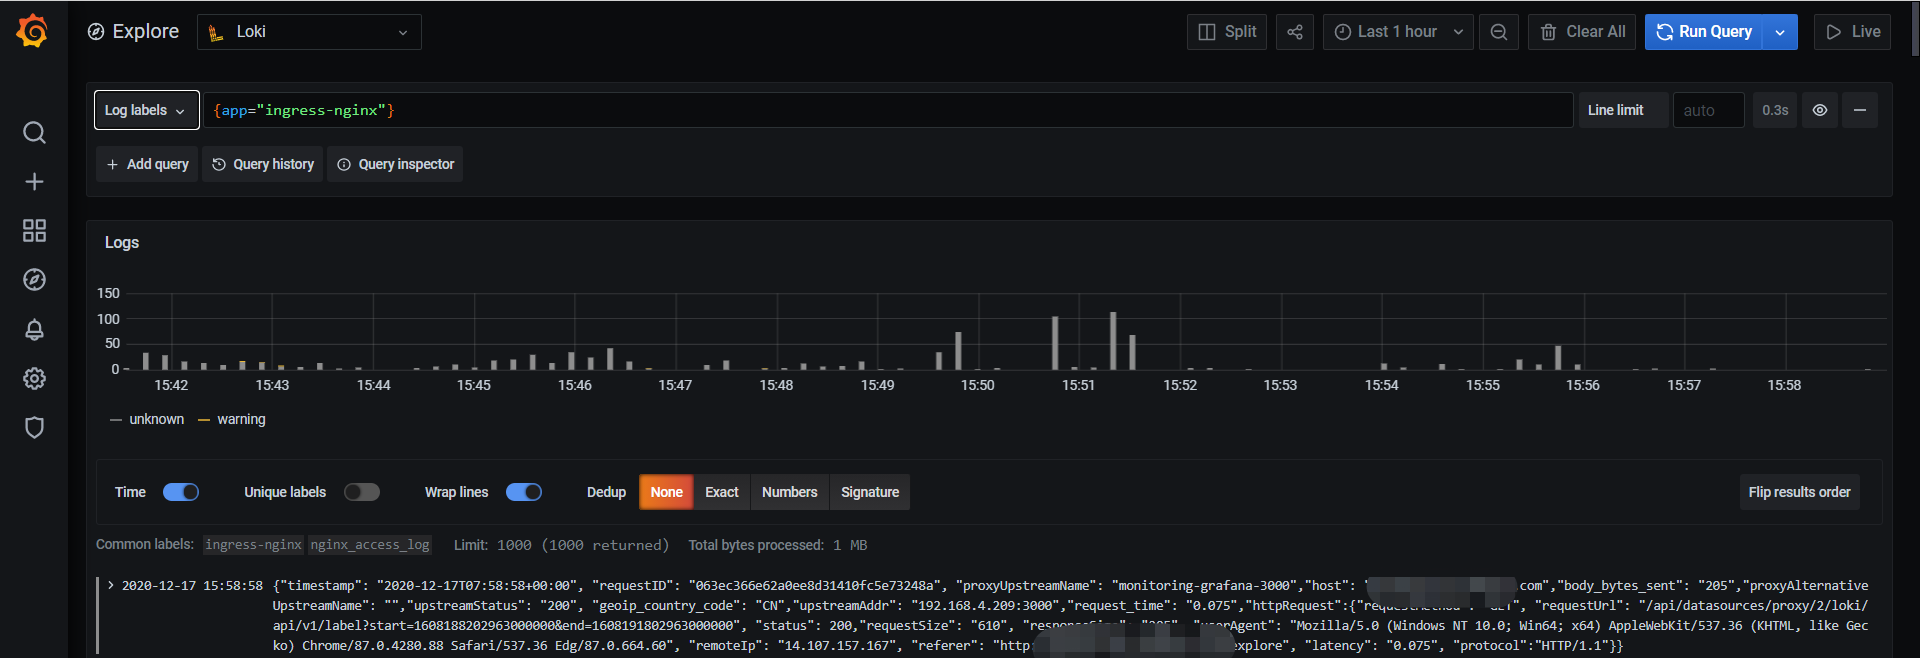
点击查看是否能正常收到日志。
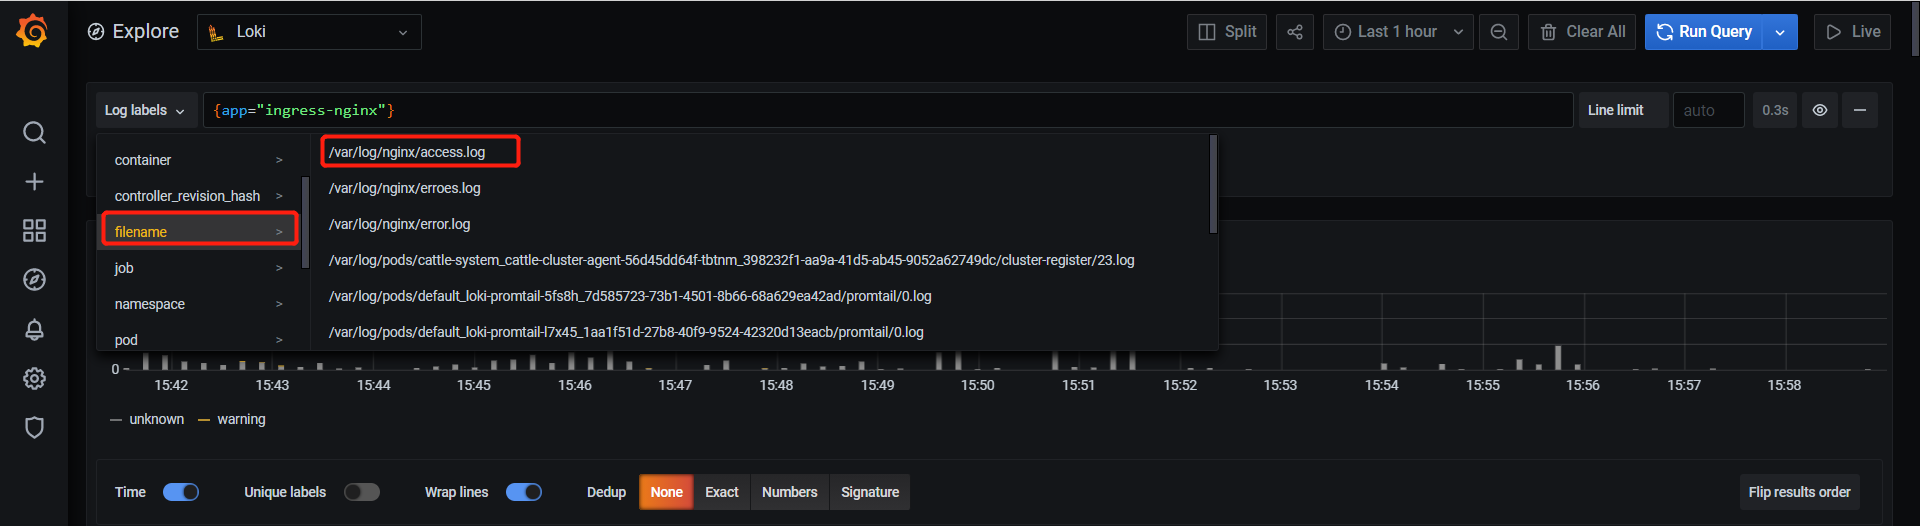
也可以看查看 filename label,是否有 nginx-ingress 的日志
(3)添加 Dashboard
通过上面的步骤一切准备就绪了,现在就添加 Dashboard,我这里将完整的 Json 文件放在 gitee 上,地址为:https://gitee.com/coolops/grafana-dashboard/blob/master/loki-nginx-ingress/dashboard.json,可以直接复制导入。也可以导入官方的 Dashboard(ID:12559)自己做相应的修改,或者直接用官方的日志格式,就可以直接导入使用了。
导入过后,展示如下:
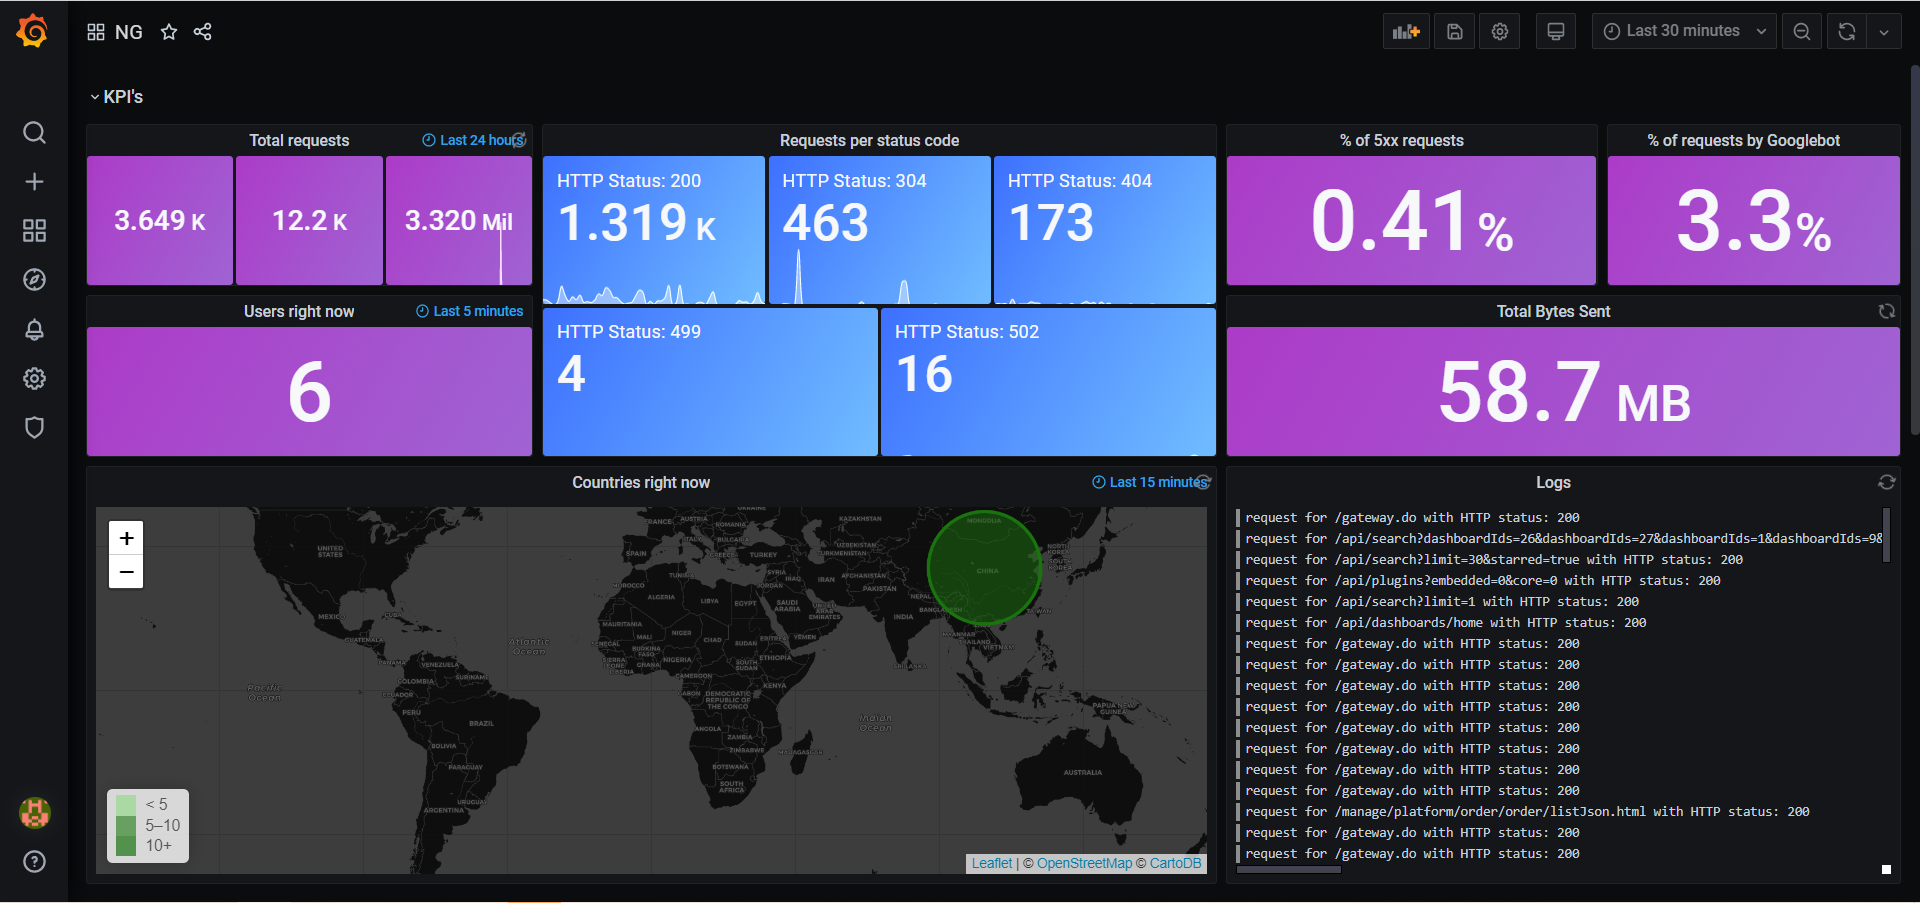
可以根据自己实际情况进行添加或删除。
注
如果不是 json 字段的日志格式,也可以用 pipeline 的格式自己做分词,比如:
yaml
promtail:

  enabled: true

  affinity:

    nodeAffinity:

      requiredDuringSchedulingIgnoredDuringExecution:

        nodeSelectorTerms:

          - matchExpressions:

              - key: category

                operator: In

                values:

                  - ingress

  volumeMounts:

  - name: nginx

    mountPath: /var/log/nginx

    readOnly: true

  volumes:

  - name: nginx

    hostPath:

      path: /var/log/nginx-master

  scrapeConfigs:

  - job_name: kubernetes-nginx-ingress

    static_configs:

    - targets:

        - localhost

      labels:

        job: nginx_access_log

        app: ingress-nginx

        __path__: /var/log/nginx/access.log

    pipeline_stages:

    - match:

        selector: '{app="ingress-nginx"}'

        stages:

        - regex:

            expression: '^(?P<remote_addr>[\w\.]+) \[(?P<time_local>.*)\] (?P<request_method>\w{3,5}) "(?P<scheme>\w{4,5})\:\/\/(?P<host>[A-Za-z0-9.]+)(?P<request_uri>/.*)(?P<query_parm>\?{0,1}.*)" (?P<status>[\d]+) (?P<bytes_sent>[\d]+) (?P<request_length>[\d]+) (?P<other>.*)'

        - labels:

            remote_addr:

            time_local:

            request_method:

            scheme:

            host:

            request_uri:

            status:

            bytes_sent:

            request_length:

            http_referer:

            http_user_agent:

            request_time:

            proxy_upstream_name:

            upstream_addr:

            upstream_response_time:

            upstream_status: