 日志系统搭建
# 一、EFK
Kubernetes 中比较流行的日志收集解决方案是 Elasticsearch、Fluentd 和 Kibana(EFK)技术栈,也是官方现在比较推荐的一种方案。
- Elasticsearch 是一个实时的、分布式的可扩展的搜索引擎,允许进行全文、结构化搜索,它通常用于索引和搜索大量日志数据,也可用于搜索许多不同类型的文档。
- Kibana 是 Elasticsearch 的一个功能强大的数据可视化 Dashboard,Kibana 允许你通过 web 界面来浏览 Elasticsearch 日志数据。
- Fluentd 是一个流行的开源数据收集器,我们将在 Kubernetes 集群节点上安装 Fluentd,通过获取容器日志文件、过滤和转换日志数据,然后将数据传递到 Elasticsearch 集群,在该集群中对其进行索引和存储。
我们先来配置启动一个可扩展的 Elasticsearch 集群,然后在 Kubernetes 集群中创建一个 Kibana 应用,最后通过 DaemonSet 来运行 Fluentd,以便它在每个 Kubernetes 工作节点上都可以运行一个 Pod。
# 1.1、部署 ElasticSearch
首先,新建一个 namespace:
efk-namespace.yaml
apiVersion: v1
kind: Namespace
metadata:
  name: kube-ops
2
3
4
然后开始部署 3 个节点的 ElasticSearch。其中关键点是应该设置 discover.zen.minimum_master_nodes=N/2+1,其中 N 是 Elasticsearch 集群中符合主节点的节点数,比如我们这里 3 个节点,意味着 N 应该设置为 2。这样,如果一个节点暂时与集群断开连接,则另外两个节点可以选择一个新的主节点,并且集群可以在最后一个节点尝试重新加入时继续运行,在扩展 Elasticsearch 集群时,一定要记住这个参数。
(1)、创建一个 elasticsearch 的无头服务
elasticsearch-svc.yaml
apiVersion: v1
kind: Service
metadata:
  name: elasticsearch
  namespace: kube-ops
  labels:
    app: elasticsearch
spec:
  selector:
    app: elasticsearch
  clusterIP: None
  ports:
    - name: rest
      port: 9200
    - name: inter-node
      port: 9300
2
3
4
5
6
7
8
9
10
11
12
13
14
15
16
定义为无头服务,是因为我们后面真正部署 elasticsearch 的 pod 是通过 statefulSet 部署的,到时候将其进行关联,另外 9200 是 REST API 端口,9300 是集群间通信端口。
然后我们创建这个资源对象。
## kubectl apply -f elasticsearch-svc.yaml
service/elasticsearch created
## kubectl get svc -n kube-ops
NAME            TYPE        CLUSTER-IP      EXTERNAL-IP   PORT(S)             AGE
elasticsearch   ClusterIP   None            <none>        9200/TCP,9300/TCP   9s
2
3
4
5
(2)、用 StatefulSet 创建 elasticsearch 的 Pod。
cat elasticsearch-elasticsearch.yaml
apiVersion: apps/v1
kind: StatefulSet
metadata:
  name: es-cluster
  namespace: kube-ops
spec:
  serviceName: elasticsearch
  replicas: 3
  selector:
    matchLabels:
      app: elasticsearch
  template:
    metadata:
      labels:
        app: elasticsearch
    spec:
      containers:
        - name: elasticsearch
          image: docker.elastic.co/elasticsearch/elasticsearch-oss:6.4.3
          resources:
            limits:
              cpu: 1000m
            requests:
              cpu: 100m
          ports:
            - containerPort: 9200
              name: rest
              protocol: TCP
            - containerPort: 9300
              name: inter-node
              protocol: TCP
          volumeMounts:
            - name: data
              mountPath: /usr/share/elasticsearch/data
          env:
            - name: cluster.name
              value: k8s-logs
            - name: node.name
              valueFrom:
                fieldRef:
                  fieldPath: metadata.name
            - name: discovery.zen.ping.unicast.hosts
              value: "es-cluster-0.elasticsearch,es-cluster-1.elasticsearch,es-cluster-2.elasticsearch"
            - name: discovery.zen.minimum_master_nodes
              value: "2"
            - name: ES_JAVA_OPTS
              value: "-Xms512m -Xmx512m"
      initContainers:
        - name: fix-permissions
          image: busybox
          command:
            ["sh", "-c", "chown -R 1000:1000 /usr/share/elasticsearch/data"]
          securityContext:
            privileged: true
          volumeMounts:
            - name: data
              mountPath: /usr/share/elasticsearch/data
        - name: increase-vm-max-map
          image: busybox
          command: ["sysctl", "-w", "vm.max_map_count=262144"]
          securityContext:
            privileged: true
        - name: increase-fd-ulimit
          image: busybox
          command: ["sh", "-c", "ulimit -n 65536"]
          securityContext:
            privileged: true
  volumeClaimTemplates:
    - metadata:
        name: data
        labels:
          app: elasticsearch
      spec:
        accessModes: ["ReadWriteOnce"]
        storageClassName: es-data-db
        resources:
          requests:
            storage: 20Gi
2
3
4
5
6
7
8
9
10
11
12
13
14
15
16
17
18
19
20
21
22
23
24
25
26
27
28
29
30
31
32
33
34
35
36
37
38
39
40
41
42
43
44
45
46
47
48
49
50
51
52
53
54
55
56
57
58
59
60
61
62
63
64
65
66
67
68
69
70
71
72
73
74
75
76
77
78
解释:
上面 Pod 中定义了两种类型的 container,普通的 container 和 initContainer。其中在 initContainer 种它有 3 个 container,它们会在所有容器启动前运行。
- 名为 fix-permissions 的 container 的作用是将 Elasticsearch 数据目录的用户和组更改为 1000:1000(Elasticsearch 用户的 UID)。因为默认情况下,Kubernetes 用 root 用户挂载数据目录,这会使得 Elasticsearch 无法方法该数据目录。
- 名为 increase-vm-max-map 的容器用来增加操作系统对 mmap 计数的限制,默认情况下该值可能太低,导致内存不足的错误
- 名为 increase-fd-ulimit 的容器用来执行 ulimit 命令增加打开文件描述符的最大数量
在普通 container 中,我们定义了名为 elasticsearch 的 container,然后暴露了 9200 和 9300 两个端口,注意名称要和上面定义的 Service 保持一致。然后通过 volumeMount 声明了数据持久化目录,下面我们再来定义 VolumeClaims。最后就是我们在容器中设置的一些环境变量了:
- cluster.name:Elasticsearch 集群的名称,我们这里命名成 k8s-logs。
- node.name:节点的名称,通过 metadata.name 来获取。这将解析为 es-cluster-[0,1,2],取决于节点的指定顺序。
- discovery.zen.ping.unicast.hosts:此字段用于设置在 Elasticsearch 集群中节点相互连接的发现方法。我们使用 unicastdiscovery 方式,它为我们的集群指定了一个静态主机列表。由于我们之前配置的无头服务,我们的 Pod 具有唯一的 DNS 域 es-cluster-[0,1,2].elasticsearch.logging.svc.cluster.local,因此我们相应地设置此变量。由于都在同一个 namespace 下面,所以我们可以将其缩短为 es-cluster-[0,1,2].elasticsearch。
- discovery.zen.minimum_master_nodes:我们将其设置为(N/2) + 1,N 是我们的群集中符合主节点的节点的数量。我们有 3 个 Elasticsearch 节点,因此我们将此值设置为 2(向下舍入到最接近的整数)。
- ES_JAVA_OPTS:这里我们设置为-Xms512m -Xmx512m,告诉 JVM 使用 512 MB 的最小和最大堆。您应该根据群集的资源可用性和需求调整这些参数
当然我们还需要创建一个 StorageClass,因为我们的数据是需要持久化的。
elasticsearch-storage.yaml
apiVersion: storage.k8s.io/v1
kind: StorageClass
metadata:
  name: es-data-db
provisioner: rookieops/nfs
2
3
4
5
注意:由于我们这里采用的是 NFS 来存储,所以上面的 provisioner 需要和我们 nfs-client-provisoner 中保持一致。
然后我们创建资源:
## kubectl apply -f elasticsearch-storage.yaml
## kubectl apply -f elasticsearch-elasticsearch.yaml
## kubectl get pod -n kube-ops
NAME                             READY   STATUS    RESTARTS   AGE
dingtalk-hook-8497494dc6-s6qkh   1/1     Running   0          16m
es-cluster-0                     1/1     Running   0          10m
es-cluster-1                     1/1     Running   0          10m
es-cluster-2                     1/1     Running   0          9m20s
## kubectl get pvc -n kube-ops
NAME                STATUS   VOLUME                                     CAPACITY   ACCESS MODES   STORAGECLASS   AGE
data-es-cluster-0   Bound    pvc-9f15c0f8-60a8-485d-b650-91fb8f5f8076   10Gi       RWO            es-data-db     18m
data-es-cluster-1   Bound    pvc-503828ec-d98e-4e94-9f00-eaf6c05f3afd   10Gi       RWO            es-data-db     11m
data-es-cluster-2   Bound    pvc-3d2eb82e-396a-4eb0-bb4e-2dd4fba8600e   10Gi       RWO            es-data-db     10m
## kubectl get svc -n kube-ops
NAME            TYPE        CLUSTER-IP     EXTERNAL-IP   PORT(S)             AGE
dingtalk-hook   ClusterIP   10.68.122.48   <none>        5000/TCP            18m
elasticsearch   ClusterIP   None           <none>        9200/TCP,9300/TCP   19m
2
3
4
5
6
7
8
9
10
11
12
13
14
15
16
17
测试:
## kubectl port-forward es-cluster-0 9200:9200 --namespace=kube-ops
Forwarding from 127.0.0.1:9200 -> 9200
Forwarding from [::1]:9200 -> 9200
Handling connection for 9200
2
3
4
5
如果看到如下结果,就表示服务正常:
## curl http://localhost:9200/_cluster/state?pretty
{
  "cluster_name" : "k8s-logs",
  "compressed_size_in_bytes" : 337,
  "cluster_uuid" : "nzc4y-eDSuSaYU1TigFAWw",
  "version" : 3,
  "state_uuid" : "6Mvd-WTPT0e7WMJV23Vdiw",
  "master_node" : "KRyMrbS0RXSfRkpS0ZaarQ",
  "blocks" : { },
  "nodes" : {
    "XGP4TrkrQ8KNMpH3pQlaEQ" : {
      "name" : "es-cluster-2",
      "ephemeral_id" : "f-R_IyfoSYGhY27FmA41Tg",
      "transport_address" : "172.20.1.104:9300",
      "attributes" : { }
    },
    "KRyMrbS0RXSfRkpS0ZaarQ" : {
      "name" : "es-cluster-0",
      "ephemeral_id" : "FpTnJTR8S3ysmoZlPPDnSg",
      "transport_address" : "172.20.1.102:9300",
      "attributes" : { }
    },
    "Xzjk2n3xQUutvbwx2h7f4g" : {
      "name" : "es-cluster-1",
      "ephemeral_id" : "FKjRuegwToe6Fz8vgPmSNw",
      "transport_address" : "172.20.1.103:9300",
      "attributes" : { }
    }
  },
  "metadata" : {
    "cluster_uuid" : "nzc4y-eDSuSaYU1TigFAWw",
    "templates" : { },
    "indices" : { },
    "index-graveyard" : {
      "tombstones" : [ ]
    }
  },
  "routing_table" : {
    "indices" : { }
  },
  "routing_nodes" : {
    "unassigned" : [ ],
    "nodes" : {
      "KRyMrbS0RXSfRkpS0ZaarQ" : [ ],
      "XGP4TrkrQ8KNMpH3pQlaEQ" : [ ],
      "Xzjk2n3xQUutvbwx2h7f4g" : [ ]
    }
  },
  "snapshots" : {
    "snapshots" : [ ]
  },
  "restore" : {
    "snapshots" : [ ]
  },
  "snapshot_deletions" : {
    "snapshot_deletions" : [ ]
  }
}
2
3
4
5
6
7
8
9
10
11
12
13
14
15
16
17
18
19
20
21
22
23
24
25
26
27
28
29
30
31
32
33
34
35
36
37
38
39
40
41
42
43
44
45
46
47
48
49
50
51
52
53
54
55
56
57
58
# 1.2、部署 Kibana
创建 kibana 的配置清单:
kibana.yaml
apiVersion: v1
kind: Service
metadata:
  name: kibana
  namespace: kube-ops
  labels:
    app: kibana
spec:
  ports:
    - port: 5601
  type: NodePort
  selector:
    app: kibana

---
apiVersion: apps/v1
kind: Deployment
metadata:
  name: kibana
  namespace: kube-ops
  labels:
    app: kibana
spec:
  selector:
    matchLabels:
      app: kibana
  template:
    metadata:
      labels:
        app: kibana
    spec:
      containers:
        - name: kibana
          image: docker.elastic.co/kibana/kibana-oss:6.4.3
          resources:
            limits:
              cpu: 1000m
            requests:
              cpu: 100m
          env:
            - name: ELASTICSEARCH_URL
              value: http://elasticsearch:9200
          ports:
            - containerPort: 5601
2
3
4
5
6
7
8
9
10
11
12
13
14
15
16
17
18
19
20
21
22
23
24
25
26
27
28
29
30
31
32
33
34
35
36
37
38
39
40
41
42
43
44
创建配置清单:
## kubectl apply -f kibana.yaml
service/kibana created
deployment.apps/kibana created

## kubectl get svc -n kube-ops
NAME            TYPE        CLUSTER-IP     EXTERNAL-IP   PORT(S)             AGE
dingtalk-hook   ClusterIP   10.68.122.48   <none>        5000/TCP            47m
elasticsearch   ClusterIP   None           <none>        9200/TCP,9300/TCP   48m
kibana          NodePort    10.68.221.60   <none>        5601:26575/TCP      7m29s
[root@ecs-5704-0003 storage]## kubectl get pod -n kube-ops
NAME                             READY   STATUS    RESTARTS   AGE
dingtalk-hook-8497494dc6-s6qkh   1/1     Running   0          47m
es-cluster-0                     1/1     Running   0          41m
es-cluster-1                     1/1     Running   0          41m
es-cluster-2                     1/1     Running   0          40m
kibana-7fc9f8c964-68xbh          1/1     Running   0          7m41s
2
3
4
5
6
7
8
9
10
11
12
13
14
15
16
如下 kibana 可以正常连接。
# 1.3、部署 Fluentd
Fluentd 是一个高效的日志聚合器,是用 Ruby 编写的,并且可以很好地扩展。对于大部分企业来说,Fluentd 足够高效并且消耗的资源相对较少,另外一个工具 Fluent-bit 更轻量级,占用资源更少,但是插件相对 Fluentd 来说不够丰富,所以整体来说,Fluentd 更加成熟,使用更加广泛,所以我们这里也同样使用 Fluentd 来作为日志收集工具。
# 1.3.1、工作原理
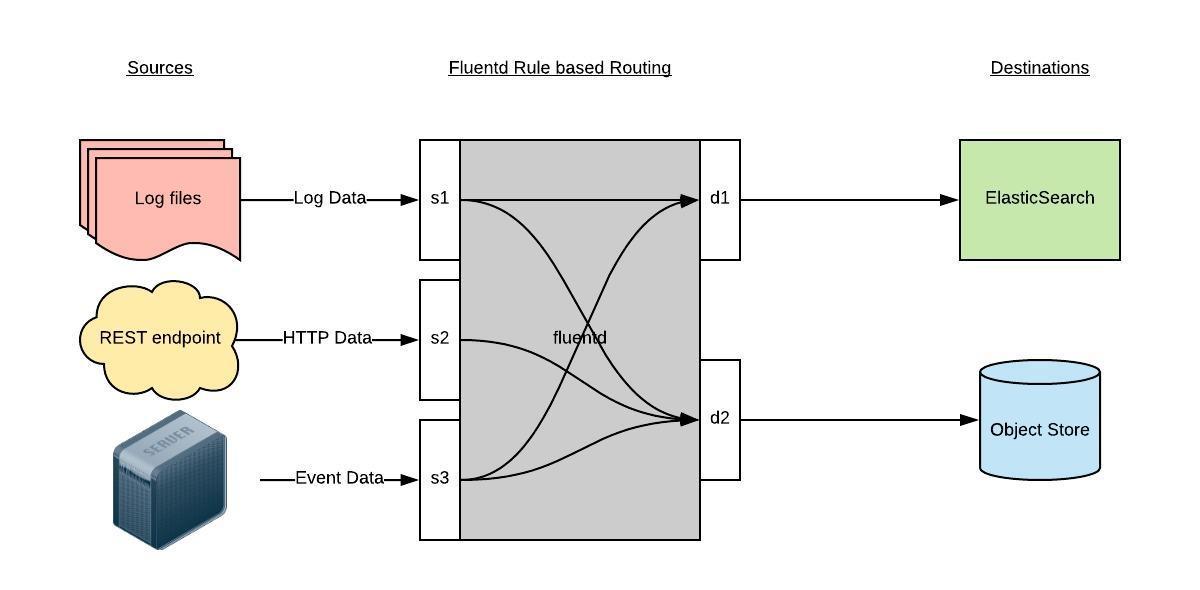
Fluentd 通过一组给定的数据源抓取日志数据,处理后(转换成结构化的数据格式)将它们转发给其他服务,比如 Elasticsearch、对象存储等等。Fluentd 支持超过 300 个日志存储和分析服务,所以在这方面是非常灵活的。主要运行步骤如下:
- 首先 Fluentd 从多个日志源获取数据
- 结构化并且标记这些数据
- 然后根据匹配的标签将数据发送到多个目标服务去
# 1.3.2、配置讲解
比如我们这里为了收集 Kubernetes 节点上的所有容器日志,就需要做如下的日志源配置:
<source>
@id fluentd-containers.log
@type tail
path /var/log/containers/*.log
pos_file /var/log/fluentd-containers.log.pos
time_format %Y-%m-%dT%H:%M:%S.%NZ
tag raw.kubernetes.*
format json
read_from_head true
</source>
2
3
4
5
6
7
8
9
10
上面配置部分参数说明如下:
- id:表示引用该日志源的唯一标识符,该标识可用于进一步过滤和路由结构化日志数据
- type:Fluentd 内置的指令,
tail表示 Fluentd 从上次读取的位置通过 tail 不断获取数据,另外一个是http表示通过一个 GET 请求来收集数据。 - path:
tail类型下的特定参数,告诉 Fluentd 采集/var/log/containers目录下的所有日志,这是 docker 在 Kubernetes 节点上用来存储运行容器 stdout 输出日志数据的目录。 - pos_file:检查点,如果 Fluentd 程序重新启动了,它将使用此文件中的位置来恢复日志数据收集。
- tag:用来将日志源与目标或者过滤器匹配的自定义字符串,Fluentd 匹配源/目标标签来路由日志数据。
#
路由配置如下:
上面是日志源的配置,接下来看看如何将日志数据发送到 Elasticsearch:
<match **>
@id elasticsearch
@type elasticsearch
@log_level info
include_tag_key true
type_name fluentd
host "#{ENV['OUTPUT_HOST']}"
port "#{ENV['OUTPUT_PORT']}"
logstash_format true
<buffer>
@type file
path /var/log/fluentd-buffers/kubernetes.system.buffer
flush_mode interval
retry_type exponential_backoff
flush_thread_count 2
flush_interval 5s
retry_forever
retry_max_interval 30
chunk_limit_size "#{ENV['OUTPUT_BUFFER_CHUNK_LIMIT']}"
queue_limit_length "#{ENV['OUTPUT_BUFFER_QUEUE_LIMIT']}"
overflow_action block
</buffer>
2
3
4
5
6
7
8
9
10
11
12
13
14
15
16
17
18
19
20
21
22
- match:标识一个目标标签,后面是一个匹配日志源的正则表达式,我们这里想要捕获所有的日志并将它们发送给 Elasticsearch,所以需要配置成
**。 - id:目标的一个唯一标识符。
- type:支持的输出插件标识符,我们这里要输出到 Elasticsearch,所以配置成 elasticsearch,这是 Fluentd 的一个内置插件。
- log_level:指定要捕获的日志级别,我们这里配置成
info,表示任何该级别或者该级别以上(INFO、WARNING、ERROR)的日志都将被路由到 Elsasticsearch。 - host/port:定义 Elasticsearch 的地址,也可以配置认证信息,我们的 Elasticsearch 不需要认证,所以这里直接指定 host 和 port 即可。
- logstash_format:Elasticsearch 服务对日志数据构建反向索引进行搜索,将 logstash_format 设置为
true,Fluentd 将会以 logstash 格式来转发结构化的日志数据。 - Buffer: Fluentd 允许在目标不可用时进行缓存,比如,如果网络出现故障或者 Elasticsearch 不可用的时候。缓冲区配置也有助于降低磁盘的 IO。
# 1.3.3、安装
通过 configmap 来定义 fluentd 的配置文件
fluentd-config.yaml
kind: ConfigMap
apiVersion: v1
metadata:
  name: fluentd-config
  namespace: kube-ops
  labels:
    addonmanager.kubernetes.io/mode: Reconcile
data:
  system.conf: |-
    <system>
      root_dir /tmp/fluentd-buffers/
    </system>
  containers.input.conf: |-
    <source>
      @id fluentd-containers.log
      @type tail
      path /var/log/containers/*.log
      pos_file /var/log/es-containers.log.pos
      time_format %Y-%m-%dT%H:%M:%S.%NZ
      localtime
      tag raw.kubernetes.*
      format json
      read_from_head true
    </source>
    ## Detect exceptions in the log output and forward them as one log entry.
    <match raw.kubernetes.**>
      @id raw.kubernetes
      @type detect_exceptions
      remove_tag_prefix raw
      message log
      stream stream
      multiline_flush_interval 5
      max_bytes 500000
      max_lines 1000
    </match>
  system.input.conf: |-
    ## Logs from systemd-journal for interesting services.
    <source>
      @id journald-docker
      @type systemd
      filters [{ "_SYSTEMD_UNIT": "docker.service" }]
      <storage>
        @type local
        persistent true
      </storage>
      read_from_head true
      tag docker
    </source>
    <source>
      @id journald-kubelet
      @type systemd
      filters [{ "_SYSTEMD_UNIT": "kubelet.service" }]
      <storage>
        @type local
        persistent true
      </storage>
      read_from_head true
      tag kubelet
    </source>
  forward.input.conf: |-
    ## Takes the messages sent over TCP
    <source>
      @type forward
    </source>
  output.conf: |-
    ## Enriches records with Kubernetes metadata
    <filter kubernetes.**>
      @type kubernetes_metadata
    </filter>
    <match **>
      @id elasticsearch
      @type elasticsearch
      @log_level info
      include_tag_key true
      host elasticsearch
      port 9200
      logstash_format true
      request_timeout    30s
      <buffer>
        @type file
        path /var/log/fluentd-buffers/kubernetes.system.buffer
        flush_mode interval
        retry_type exponential_backoff
        flush_thread_count 2
        flush_interval 5s
        retry_forever
        retry_max_interval 30
        chunk_limit_size 2M
        queue_limit_length 8
        overflow_action block
      </buffer>
    </match>
2
3
4
5
6
7
8
9
10
11
12
13
14
15
16
17
18
19
20
21
22
23
24
25
26
27
28
29
30
31
32
33
34
35
36
37
38
39
40
41
42
43
44
45
46
47
48
49
50
51
52
53
54
55
56
57
58
59
60
61
62
63
64
65
66
67
68
69
70
71
72
73
74
75
76
77
78
79
80
81
82
83
84
85
86
87
88
89
90
91
92
上面配置文件中我们配置了 docker 容器日志目录以及 docker、kubelet 应用的日志的收集,收集到数据经过处理后发送到 elasticsearch:9200 服务。
创建配置文件:
## kubectl apply -f fluentd-config.yaml
configmap/fluentd-config created
## kubectl get cm -n kube-ops
NAME             DATA   AGE
fluentd-config   5      115s
2
3
4
5
以 DS 模式运行 fluentd,配置清单如下:
fluentd-daemonset.yaml
apiVersion: v1
kind: ServiceAccount
metadata:
  name: fluentd-es
  namespace: kube-ops
  labels:
    k8s-app: fluentd-es
    kubernetes.io/cluster-service: "true"
    addonmanager.kubernetes.io/mode: Reconcile
---
kind: ClusterRole
apiVersion: rbac.authorization.k8s.io/v1
metadata:
  name: fluentd-es
  labels:
    k8s-app: fluentd-es
    kubernetes.io/cluster-service: "true"
    addonmanager.kubernetes.io/mode: Reconcile
rules:
  - apiGroups:
      - ""
    resources:
      - "namespaces"
      - "pods"
    verbs:
      - "get"
      - "watch"
      - "list"
---
kind: ClusterRoleBinding
apiVersion: rbac.authorization.k8s.io/v1
metadata:
  name: fluentd-es
  labels:
    k8s-app: fluentd-es
    kubernetes.io/cluster-service: "true"
    addonmanager.kubernetes.io/mode: Reconcile
subjects:
  - kind: ServiceAccount
    name: fluentd-es
    namespace: kube-ops
    apiGroup: ""
roleRef:
  kind: ClusterRole
  name: fluentd-es
  apiGroup: ""
---
apiVersion: apps/v1
kind: DaemonSet
metadata:
  name: fluentd-es
  namespace: kube-ops
  labels:
    k8s-app: fluentd-es
    version: v2.0.4
    kubernetes.io/cluster-service: "true"
    addonmanager.kubernetes.io/mode: Reconcile
spec:
  selector:
    matchLabels:
      k8s-app: fluentd-es
      version: v2.0.4
  template:
    metadata:
      labels:
        k8s-app: fluentd-es
        kubernetes.io/cluster-service: "true"
        version: v2.0.4
      ## This annotation ensures that fluentd does not get evicted if the node
      ## supports critical pod annotation based priority scheme.
      ## Note that this does not guarantee admission on the nodes (#40573).
      annotations:
        scheduler.alpha.kubernetes.io/critical-pod: ""
    spec:
      serviceAccountName: fluentd-es
      containers:
        - name: fluentd-es
          image: cnych/fluentd-elasticsearch:v2.0.4
          env:
            - name: FLUENTD_ARGS
              value: --no-supervisor -q
          resources:
            limits:
              memory: 500Mi
            requests:
              cpu: 100m
              memory: 200Mi
          volumeMounts:
            - name: varlog
              mountPath: /var/log
            - name: varlibdockercontainers
              mountPath: /var/lib/docker/containers
              readOnly: true
            - name: config-volume
              mountPath: /etc/fluent/config.d
      nodeSelector:
        beta.kubernetes.io/fluentd-ds-ready: "true"
      tolerations:
        - key: node-role.kubernetes.io/master
          operator: Exists
          effect: NoSchedule
      terminationGracePeriodSeconds: 30
      volumes:
        - name: varlog
          hostPath:
            path: /var/log
        - name: varlibdockercontainers
          hostPath:
            path: /var/lib/docker/containers
        - name: config-volume
          configMap:
            name: fluentd-config
2
3
4
5
6
7
8
9
10
11
12
13
14
15
16
17
18
19
20
21
22
23
24
25
26
27
28
29
30
31
32
33
34
35
36
37
38
39
40
41
42
43
44
45
46
47
48
49
50
51
52
53
54
55
56
57
58
59
60
61
62
63
64
65
66
67
68
69
70
71
72
73
74
75
76
77
78
79
80
81
82
83
84
85
86
87
88
89
90
91
92
93
94
95
96
97
98
99
100
101
102
103
104
105
106
107
108
109
110
111
112
由于我们上面定义了 nodeSelector:
      nodeSelector:
        beta.kubernetes.io/fluentd-ds-ready: "true"
2
所以我们得先给 Node 打上标签:
## kubectl label nodes 172.16.0.33 beta.kubernetes.io/fluentd-ds-ready=true
node/172.16.0.33 labeled
## kubectl label nodes 172.16.0.52 beta.kubernetes.io/fluentd-ds-ready=true
node/172.16.0.52 labeled
2
3
4
然后我们创建配置清单,查看结果:
## kubectl apply -f fluentd-daemonset.yaml
## kubectl get ds -n kube-ops
NAME         DESIRED   CURRENT   READY   UP-TO-DATE   AVAILABLE   NODE SELECTOR                              AGE
fluentd-es   2         2         2       2            2           beta.kubernetes.io/fluentd-ds-ready=true   13h
## kubectl get pod -n kube-ops
NAME                             READY   STATUS    RESTARTS   AGE
dingtalk-hook-8497494dc6-s6qkh   1/1     Running   0          14h
es-cluster-0                     1/1     Running   0          14h
es-cluster-1                     1/1     Running   0          14h
es-cluster-2                     1/1     Running   0          14h
fluentd-es-h4lsp                 1/1     Running   0          26s
fluentd-es-ktx69                 1/1     Running   0          34s
2
3
4
5
6
7
8
9
10
11
12
13
先查看 ES 上的索引
kubectl port-forward es-cluster-0 9200:9200 --namespace=kube-ops
## curl -XGET 'localhost:9200/_cat/indices?v&pretty'
health status index               uuid                   pri rep docs.count docs.deleted store.size pri.store.size
green  open   logstash-2020.06.23 HR62innTQi6HjObIzf6DHw   5   1         99            0      295kb        147.5kb
green  open   logstash-2020.06.22 8-IFAOj_SqiipqOXN6Soxw   5   1       6614            0      7.9mb          3.6mb
2
3
4
5
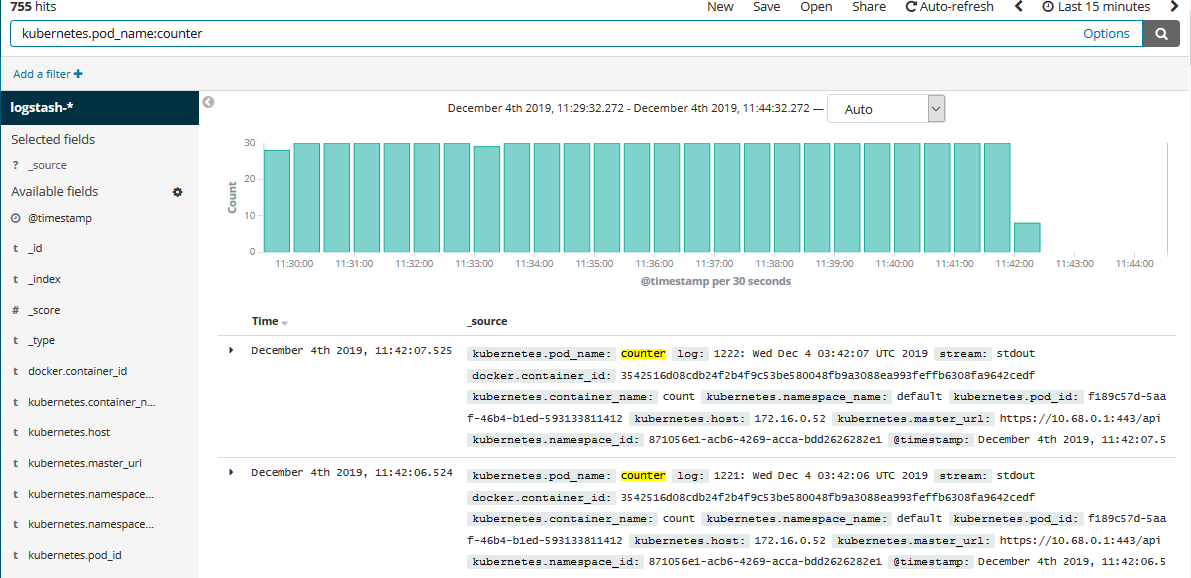
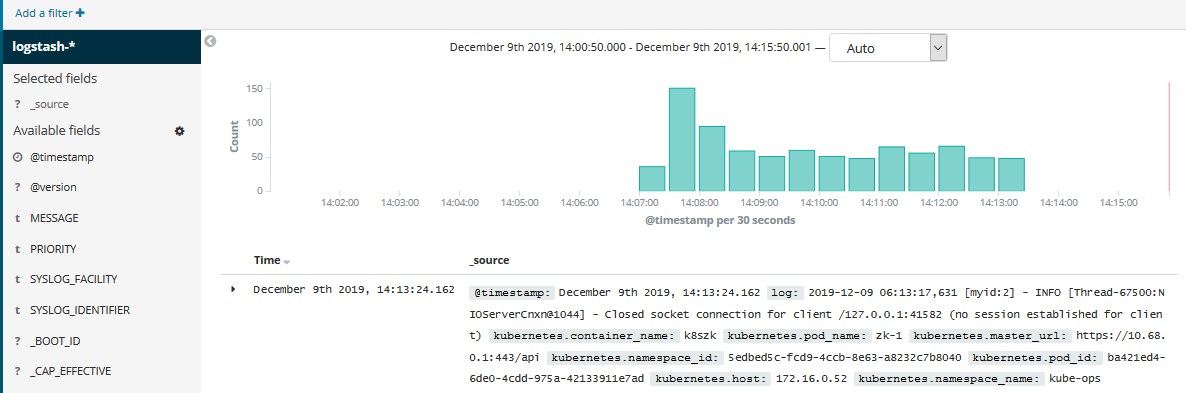
然后在 kibana 上添加
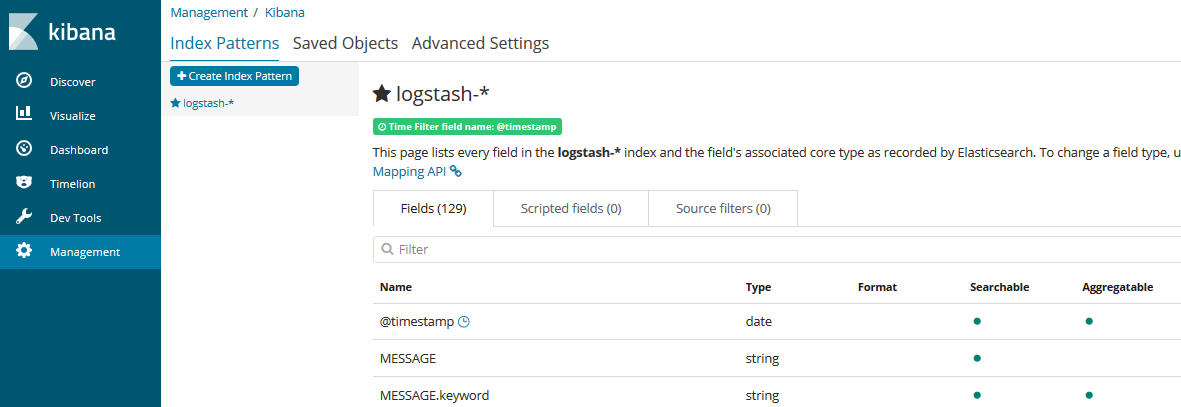
如果我们要查看某个 Pod 的 name,只需要填写过滤条件,如下:
# 1.4、部署 log-pilot
log-pilot 是阿里开源的一个日志收集工具,它的强大之处在于只需要部署一个 daemonset 类型的 pod,不仅能采集容器标准输出的日志,还能采集容器内部的文件日志,更多咨询可以移步这里 (opens new window)。缺点暂不支撑 7 的 filebeat。
apiVersion: apps/v1
kind: DaemonSet
metadata:
  name: log-pilot
  labels:
    app: log-pilot
  namespace: kube-ops
spec:
  selector:
    matchLabels:
      app: log-pilot
  updateStrategy:
    type: RollingUpdate
  template:
    metadata:
      labels:
        app: log-pilot
      annotations:
        scheduler.alpha.kubernetes.io/critical-pod: ""
    spec:
      tolerations:
        - key: node-role.kubernetes.io/master
          effect: NoSchedule
      containers:
        - name: log-pilot
          image: registry.cn-hangzhou.aliyuncs.com/acs/log-pilot:0.9.7-filebeat
          resources:
            limits:
              memory: 500Mi
            requests:
              cpu: 200m
              memory: 200Mi
          env:
            - name: "NODE_NAME"
              valueFrom:
                fieldRef:
                  fieldPath: spec.nodeName
            ## 日志收集前缀
            - name: PILOT_LOG_PREFIX
              value: aliyun
            - name: "LOGGING_OUTPUT"
              value: "elasticsearch"
            ## 请确保集群到ES网络可达
            - name: "ELASTICSEARCH_HOSTS"
              value: "elasticsearch:9200"
            ## 配置ES访问权限
            #- name: "ELASTICSEARCH_USER"
            ##  value: "{es_username}"
            #- name: "ELASTICSEARCH_PASSWORD"
            ##  value: "{es_password}"
          volumeMounts:
            - name: sock
              mountPath: /var/run/docker.sock
            - name: root
              mountPath: /host
              readOnly: true
            - name: varlib
              mountPath: /var/lib/filebeat
            - name: varlog
              mountPath: /var/log/filebeat
            - name: localtime
              mountPath: /etc/localtime
              readOnly: true
          livenessProbe:
            failureThreshold: 3
            exec:
              command:
                - /pilot/healthz
            initialDelaySeconds: 10
            periodSeconds: 10
            successThreshold: 1
            timeoutSeconds: 2
          securityContext:
            capabilities:
              add:
                - SYS_ADMIN
      terminationGracePeriodSeconds: 30
      volumes:
        - name: sock
          hostPath:
            path: /var/run/docker.sock
        - name: root
          hostPath:
            path: /
        - name: varlib
          hostPath:
            path: /var/lib/filebeat
            type: DirectoryOrCreate
        - name: varlog
          hostPath:
            path: /var/log/filebeat
            type: DirectoryOrCreate
        - name: localtime
          hostPath:
            path: /etc/localtim
2
3
4
5
6
7
8
9
10
11
12
13
14
15
16
17
18
19
20
21
22
23
24
25
26
27
28
29
30
31
32
33
34
35
36
37
38
39
40
41
42
43
44
45
46
47
48
49
50
51
52
53
54
55
56
57
58
59
60
61
62
63
64
65
66
67
68
69
70
71
72
73
74
75
76
77
78
79
80
81
82
83
84
85
86
87
88
89
90
91
92
93
94
95
创建 pod 测试
apiVersion: v1
kind: Pod
metadata:
  name: tomcat
spec:
  containers:
    - name: tomcat
      image: "tomcat:8.0"
      env:
        ## 1、stdout为约定关键字,表示采集标准输出日志
        ## 2、配置标准输出日志采集到ES的catalina索引下
        - name: aliyun_logs_catalina
          value: "stdout"
        ## 1、配置采集容器内文件日志,支持通配符
        ## 2、配置该日志采集到ES的access索引下
        - name: aliyun_logs_access
          value: "/usr/local/tomcat/logs/catalina.*.log"
      ## 容器内文件日志路径需要配置emptyDir
      volumeMounts:
        - name: tomcat-log
          mountPath: /usr/local/tomcat/logs
  volumes:
    - name: tomcat-log
      emptyDir: {}
2
3
4
5
6
7
8
9
10
11
12
13
14
15
16
17
18
19
20
21
22
23
24
然后我们查看索引会看到 access-*和 catalina-*的索引
## curl -XGET 'localhost:9200/_cat/indices?v&pretty'
health status index               uuid                   pri rep docs.count docs.deleted store.size pri.store.size
green  open   access-2020.06.23   0LS6STfpQ4yHt7makuSI1g   5   1         40            0    205.5kb        102.5kb
green  open   logstash-2020.06.23 HR62innTQi6HjObIzf6DHw   5   1         99            0      296kb          148kb
green  open   catalina-2020.06.23 dSFGcZlPS6-wieFKrOWV-g   5   1         40            0    227.1kb        133.3kb
green  open   .kibana             H-TAto8QTxmi-jI_4mIUrg   1   1          2            0     20.4kb         10.2kb
green  open   logstash-2020.06.22 8-IFAOj_SqiipqOXN6Soxw   5   1      43784            0     30.6mb         15.3mb
2
3
4
5
6
7
然后到页面添加索引即可。
# 二、EFK+Kafka
# 2.1、部署 Kafka
# 2.1.1、搭建 ZK
技术要点:
- service 要用 headless service
- 每个 pod 有自己独有的竞选 ID(myid)
配置清单如下:
zookeeper.yaml
---
apiVersion: v1
kind: Service
metadata:
  name: zk-svc
  namespace: kube-ops
  labels:
    app: zk-svc
spec:
  ports:
    - port: 2888
      name: server
    - port: 3888
      name: leader-election
  clusterIP: None
  selector:
    app: zk
---
apiVersion: v1
kind: ConfigMap
metadata:
  name: zk-cm
  namespace: kube-ops
data:
  jvm.heap: "1G"
  tick: "2000"
  init: "10"
  sync: "5"
  client.cnxns: "60"
  snap.retain: "3"
  purge.interval: "0"
---
apiVersion: policy/v1beta1
kind: PodDisruptionBudget
metadata:
  name: zk-pdb
  namespace: kube-ops
spec:
  selector:
    matchLabels:
      app: zk
  minAvailable: 2
---
apiVersion: apps/v1beta1
kind: StatefulSet
metadata:
  name: zk
  namespace: kube-ops
spec:
  serviceName: zk-svc
  replicas: 3
  template:
    metadata:
      labels:
        app: zk
    spec:
      #affinity:
      ##  podAntiAffinity:
      ##    #requiredDuringSchedulingIgnoredDuringExecution:
      ##    preferredDuringSchedulingIgnoredDuringExecution:
      ##      cpu: "500m"
      ##      - labelSelector:
      ##          matchExpressions:
      ##            - key: "app"
      ##              operator: In
      ##              values:
      ##              - zk
      ##        topologyKey: "kubernetes.io/hostname"
      containers:
        - name: k8szk
          imagePullPolicy: Always
          image: registry.cn-hangzhou.aliyuncs.com/rookieops/zookeeper:3.4.10
          resources:
            requests:
              memory: "2Gi"
              cpu: "500m"
          ports:
            - containerPort: 2181
              name: client
            - containerPort: 2888
              name: server
            - containerPort: 3888
              name: leader-election
          env:
            - name: ZK_REPLICAS
              value: "3"
            - name: ZK_HEAP_SIZE
              valueFrom:
                configMapKeyRef:
                  name: zk-cm
                  key: jvm.heap
            - name: ZK_TICK_TIME
              valueFrom:
                configMapKeyRef:
                  name: zk-cm
                  key: tick
            - name: ZK_INIT_LIMIT
              valueFrom:
                configMapKeyRef:
                  name: zk-cm
                  key: init
            - name: ZK_SYNC_LIMIT
              valueFrom:
                configMapKeyRef:
                  name: zk-cm
                  key: tick
            - name: ZK_MAX_CLIENT_CNXNS
              valueFrom:
                configMapKeyRef:
                  name: zk-cm
                  key: client.cnxns
            - name: ZK_SNAP_RETAIN_COUNT
              valueFrom:
                configMapKeyRef:
                  name: zk-cm
                  key: snap.retain
            - name: ZK_PURGE_INTERVAL
              valueFrom:
                configMapKeyRef:
                  name: zk-cm
                  key: purge.interval
            - name: ZK_CLIENT_PORT
              value: "2181"
            - name: ZK_SERVER_PORT
              value: "2888"
            - name: ZK_ELECTION_PORT
              value: "3888"
          command:
            - sh
            - -c
            - zkGenConfig.sh && zkServer.sh start-foreground
          readinessProbe:
            exec:
              command:
                - "zkOk.sh"
            initialDelaySeconds: 10
            timeoutSeconds: 5
          livenessProbe:
            exec:
              command:
                - "zkOk.sh"
            initialDelaySeconds: 10
            timeoutSeconds: 5
          volumeMounts:
            - name: datadir
              mountPath: /var/lib/zookeeper
  ##      securityContext:
  ##        runAsUser: 1000
  ##        fsGroup: 1000
  volumeClaimTemplates:
    - metadata:
        name: datadir
      spec:
        accessModes: ["ReadWriteOnce"]
        storageClassName: zk-data-db
        resources:
          requests:
            storage: 1Gi
2
3
4
5
6
7
8
9
10
11
12
13
14
15
16
17
18
19
20
21
22
23
24
25
26
27
28
29
30
31
32
33
34
35
36
37
38
39
40
41
42
43
44
45
46
47
48
49
50
51
52
53
54
55
56
57
58
59
60
61
62
63
64
65
66
67
68
69
70
71
72
73
74
75
76
77
78
79
80
81
82
83
84
85
86
87
88
89
90
91
92
93
94
95
96
97
98
99
100
101
102
103
104
105
106
107
108
109
110
111
112
113
114
115
116
117
118
119
120
121
122
123
124
125
126
127
128
129
130
131
132
133
134
135
136
137
138
139
140
141
142
143
144
145
146
147
148
149
150
151
152
153
154
155
156
157
158
创建 storageClass:
zookeeper-storage.yaml
apiVersion: storage.k8s.io/v1
kind: StorageClass
metadata:
  name: zk-data-db
provisioner: rookieops/nfs
2
3
4
5
然后创建配置清单:
## kubectl apply -f zookeeper-storage.yaml
## kubectl apply -f zookeeper.yaml
## kubectl get pod -n kube-ops
NAME                             READY   STATUS    RESTARTS   AGE
zk-0                             1/1     Running   0          12m
zk-1                             1/1     Running   0          12m
zk-2                             1/1     Running   0          11m
2
3
4
5
6
7
然后查看集群状态:
## for i in 0 1 2; do kubectl exec -n kube-ops zk-$i zkServer.sh status; done
ZooKeeper JMX enabled by default
Using config: /usr/bin/../etc/zookeeper/zoo.cfg
Mode: follower
ZooKeeper JMX enabled by default
Using config: /usr/bin/../etc/zookeeper/zoo.cfg
Mode: follower
ZooKeeper JMX enabled by default
Using config: /usr/bin/../etc/zookeeper/zoo.cfg
Mode: leader
2
3
4
5
6
7
8
9
10
# 2.2.2、搭建 kafka
Dockerfile:
FROM centos:centos7
LABEL "auth"="rookieops" \
      "mail"="rookieops@163.com"
ENV TIME_ZONE Asia/Shanghai

## install JAVA
ADD jdk-8u131-linux-x64.tar.gz /opt/
ENV JAVA_HOME /opt/jdk1.8.0_131
ENV PATH ${JAVA_HOME}/bin:${PATH}

## install kafka
ADD kafka_2.11-2.3.1.tgz /opt/
RUN mv /opt/kafka_2.11-2.3.1 /opt/kafka
WORKDIR /opt/kafka
EXPOSE 9092
CMD ["./bin/kafka-server-start.sh", "config/server.properties"]
2
3
4
5
6
7
8
9
10
11
12
13
14
15
16
创建 storageClass:
kafka-storage.yaml
apiVersion: storage.k8s.io/v1
kind: StorageClass
metadata:
  name: kafka-data-db
provisioner: rookieops/nfs
2
3
4
5
创建 kafka 配置清单:
kafka.yaml
apiVersion: apps/v1
kind: StatefulSet
metadata:
  name: kafka
  namespace: kube-ops
spec:
  serviceName: kafka-svc
  replicas: 3
  selector:
    matchLabels:
      app: kafka
  template:
    metadata:
      labels:
        app: kafka
    spec:
      affinity:
        podAffinity:
          preferredDuringSchedulingIgnoredDuringExecution:
            - weight: 1
              podAffinityTerm:
                labelSelector:
                  matchExpressions:
                    - key: "app"
                      operator: In
                      values:
                        - zk
                topologyKey: "kubernetes.io/hostname"
      terminationGracePeriodSeconds: 300
      containers:
        - name: kafka
          image: registry.cn-hangzhou.aliyuncs.com/rookieops/kafka:2.3.1-beta
          imagePullPolicy: Always
          resources:
            requests:
              cpu: 500m
              memory: 1Gi
            limits:
              cpu: 500m
              memory: 1Gi
          command:
            - "/bin/sh"
            - "-c"
            - "./bin/kafka-server-start.sh config/server.properties --override broker.id=${HOSTNAME##*-}"
          ports:
            - name: server
              containerPort: 9092
          volumeMounts:
            - name: config
              mountPath: /opt/kafka/config/server.properties
              subPath: server.properties
            - name: data
              mountPath: /data/kafka/logs
      ##        readinessProbe:
      ##          exec:
      ##            command:
      ##              - "/bin/sh"
      ##              - "-c"
      ##              - "/opt/kafka/bin/kafka-broker-api-versions.sh --bootstrap-server=localhost:9092"
      volumes:
        - name: config
          configMap:
            name: kafka-config
  volumeClaimTemplates:
    - metadata:
        name: data
      spec:
        accessModes: ["ReadWriteOnce"]
        storageClassName: kafka-data-db
        resources:
          requests:
            storage: 10Gi
2
3
4
5
6
7
8
9
10
11
12
13
14
15
16
17
18
19
20
21
22
23
24
25
26
27
28
29
30
31
32
33
34
35
36
37
38
39
40
41
42
43
44
45
46
47
48
49
50
51
52
53
54
55
56
57
58
59
60
61
62
63
64
65
66
67
68
69
70
71
72
创建 kafka headless service:
kafka-svc.yaml
apiVersion: v1
kind: Service
metadata:
  name: kafka-svc
  namespace: kube-ops
  labels:
    app: kafka
spec:
  selector:
    app: kafka
  clusterIP: None
  ports:
    - name: server
      port: 9092
2
3
4
5
6
7
8
9
10
11
12
13
14
创建 kafka ConfigMap 配置清单:
kafka-config.yaml
apiVersion: v1
kind: ConfigMap
metadata:
  name: kafka-config
  namespace: kube-ops
data:
  server.properties: |
    broker.id=${HOSTNAME##*-}
    listeners=PLAINTEXT://:9092
    num.network.threads=3
    num.io.threads=8
    socket.send.buffer.bytes=102400
    socket.receive.buffer.bytes=102400
    socket.request.max.bytes=104857600
    log.dirs=/data/kafka/logs
    num.partitions=1
    num.recovery.threads.per.data.dir=1
    offsets.topic.replication.factor=1
    transaction.state.log.replication.factor=1
    transaction.state.log.min.isr=1
    log.retention.hours=168
    log.segment.bytes=1073741824
    log.retention.check.interval.ms=300000
    zookeeper.connect=zk-0.zk-svc.kube-ops.svc.cluster.local:2181,zk-1.zk-svc.kube-ops.svc.cluster.local:2181,zk-2.zk-svc.kube-ops.svc.cluster.local:2181
    zookeeper.connection.timeout.ms=6000
    group.initial.rebalance.delay.ms=0
2
3
4
5
6
7
8
9
10
11
12
13
14
15
16
17
18
19
20
21
22
23
24
25
26
创建配置清单:
## kubectl apply -f kafka-storage.yaml
## kubectl apply -f kafka-svc.yaml
## kubectl apply -f kafka-config.yaml
## kubectl apply -f kafka.yaml
## kubectl get pod -n kube-ops
NAME                             READY   STATUS    RESTARTS   AGE
kafka-0                          1/1     Running   0          13m
kafka-1                          1/1     Running   0          13m
kafka-2                          1/1     Running   0          10m
zk-0                             1/1     Running   0          77m
zk-1                             1/1     Running   0          77m
zk-2                             1/1     Running   0          76m
2
3
4
5
6
7
8
9
10
11
12
测试:
## kubectl exec -it -n kube-ops kafka-0 -- /bin/bash
$ cd /opt/kafka
$ ./bin/kafka-topics.sh --create --topic test --zookeeper zk-0.zk-svc.kube-ops.svc.cluster.local:2181,zk-1.zk-svc.kube-ops.svc.cluster.local:2181,zk-2.zk-svc.kube-ops.svc.cluster.local:2181 --partitions 3 --replication-factor 2
Created topic "test".
## 消费
$ ./bin/kafka-console-consumer.sh --topic test --bootstrap-server localhost:9092
2
3
4
5
6
然后再进入一个 container:
做 producer
## kubectl exec -it -n kube-ops kafka-1 -- /bin/bash
$ cd /opt/kafka
$ ./bin/kafka-console-producer.sh --topic test --broker-list localhost:9092
hello
nihao
2
3
4
5
可以看到 consumer 上会产生消费信息:
$ ./bin/kafka-console-consumer.sh --topic test --bootstrap-server localhost:9092
hello
nihao
2
3
至此,kafka 集群搭建完成。
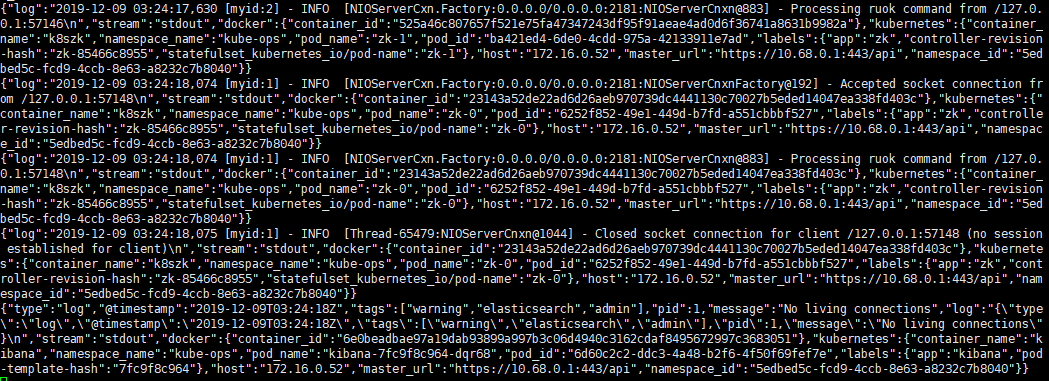
并且可以看到待消费数据:
# 2.2、部署 logstash
我们已经将日志信息发送到了 kafka,现在我们再使用 logstash 从 kafka 中消费日志然后传递给 ES。
这里我直接采用 deployment 部署了。
定义 configMap 配置清单:
logstash-config.yaml
apiVersion: v1
kind: ConfigMap
metadata:
  name: logstash-k8s-config
  namespace: kube-ops
data:
  containers.conf: |
    input {
      kafka {
        codec => "json"
        topics => ["test"]
        bootstrap_servers => ["kafka-0.kafka-svc.kube-ops:9092, kafka-1.kafka-svc.kube-ops:9092, kafka-2.kafka-svc.kube-ops:9092"]
        group_id => "logstash-g1"
      }
    }
    output {
      elasticsearch {
        hosts => ["es-cluster-0.elasticsearch.kube-ops:9200", "es-cluster-1.elasticsearch.kube-ops:9200", "es-cluster-2.elasticsearch.kube-ops:9200"]
        index => "logstash-%{+YYYY.MM.dd}"
      }
    }
2
3
4
5
6
7
8
9
10
11
12
13
14
15
16
17
18
19
20
21
定义 Deploy 配置清单:
logstash.yaml
kind: Deployment
metadata:
  name: logstash
  namespace: kube-ops
spec:
  replicas: 1
  selector:
    matchLabels:
      app: logstash
  template:
    metadata:
      labels:
        app: logstash
    spec:
      containers:
        - name: logstash
          image: registry.cn-hangzhou.aliyuncs.com/rookieops/logstash-kubernetes:7.1.1
          volumeMounts:
            - name: config
              mountPath: /opt/logstash/config/containers.conf
              subPath: containers.conf
          command:
            - "/bin/sh"
            - "-c"
            - "/opt/logstash/bin/logstash -f /opt/logstash/config/containers.conf"
      volumes:
        - name: config
          configMap:
            name: logstash-k8s-config
2
3
4
5
6
7
8
9
10
11
12
13
14
15
16
17
18
19
20
21
22
23
24
25
26
27
28
29
然后生成配置:
## kubectl apply -f logstash-config.yaml
## kubectl apply -f logstash.yaml
2
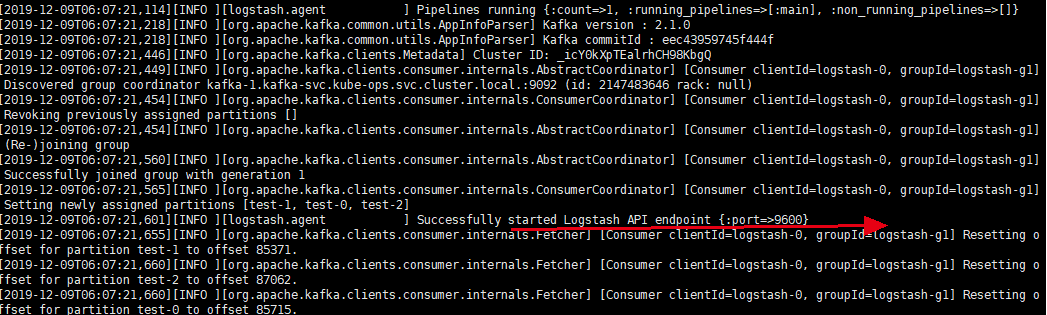
然后观察状态,查看日志:
## kubectl get pod -n kube-ops
NAME                             READY   STATUS    RESTARTS   AGE
dingtalk-hook-856c5dbbc9-srcm6   1/1     Running   0          3d20h
es-cluster-0                     1/1     Running   0          22m
es-cluster-1                     1/1     Running   0          22m
es-cluster-2                     1/1     Running   0          22m
fluentd-es-jvhqv                 1/1     Running   0          179m
fluentd-es-s7v6m                 1/1     Running   0          179m
kafka-0                          1/1     Running   0          3h6m
kafka-1                          1/1     Running   0          3h6m
kafka-2                          1/1     Running   0          3h6m
kibana-7fc9f8c964-dqr68          1/1     Running   0          5d2h
logstash-678c945764-lkl2n        1/1     Running   0          10m
zk-0                             1/1     Running   0          3d21h
zk-1                             1/1     Running   0          3d21h
zk-2                             1/1     Running   0          3d21h
2
3
4
5
6
7
8
9
10
11
12
13
14
15
16
17
# 2.3、部署 ES
# 2.4、部署 kibana
# 2.5、部署 fluentd
首先需要安装 fluent-plugin-kafka 插件,因为原生 fluentd 镜像中并没有安装此插件。
安装步骤:
(1)、先用 docker 起一个容器
## docker run -it registry.cn-hangzhou.aliyuncs.com/rookieops/fluentd-elasticsearch:v2.0.4 /bin/bash
$ gem install fluent-plugin-kafka --no-document
2
(2)、退出容器,重新 commit 一下:
## docker commit c29b250d8df9 registry.cn-hangzhou.aliyuncs.com/rookieops/fluentd-elasticsearch:v2.0.4
(3)、将安装了插件的镜像推向仓库:
## docker push registry.cn-hangzhou.aliyuncs.com/rookieops/fluentd-elasticsearch:v2.0.4
配置 fluentd 的 configMap:
fluentd-config.yaml
kind: ConfigMap
apiVersion: v1
metadata:
  name: fluentd-config
  namespace: kube-ops
  labels:
    addonmanager.kubernetes.io/mode: Reconcile
data:
  system.conf: |-
    <system>
      root_dir /tmp/fluentd-buffers/
    </system>
  containers.input.conf: |-
    <source>
      @id fluentd-containers.log
      @type tail
      path /var/log/containers/*.log
      pos_file /var/log/es-containers.log.pos
      time_format %Y-%m-%dT%H:%M:%S.%NZ
      localtime
      tag raw.kubernetes.*
      format json
      read_from_head true
    </source>
    ## Detect exceptions in the log output and forward them as one log entry.
    <match raw.kubernetes.**>
      @id raw.kubernetes
      @type detect_exceptions
      remove_tag_prefix raw
      message log
      stream stream
      multiline_flush_interval 5
      max_bytes 500000
      max_lines 1000
    </match>
  system.input.conf: |-
    ## Logs from systemd-journal for interesting services.
    <source>
      @id journald-docker
      @type systemd
      filters [{ "_SYSTEMD_UNIT": "docker.service" }]
      <storage>
        @type local
        persistent true
      </storage>
      read_from_head true
      tag docker
    </source>
    <source>
      @id journald-kubelet
      @type systemd
      filters [{ "_SYSTEMD_UNIT": "kubelet.service" }]
      <storage>
        @type local
        persistent true
      </storage>
      read_from_head true
      tag kubelet
    </source>
  forward.input.conf: |-
    ## Takes the messages sent over TCP
    <source>
      @type forward
    </source>
  output.conf: |-
    ## Enriches records with Kubernetes metadata
    <filter kubernetes.**>
      @type kubernetes_metadata
    </filter>
    <match **>
      @id kafka
      @type kafka2
      @log_level info
      include_tag_key true
      brokers kafka-0.kafka-svc.kube-ops:9092,kafka-1.kafka-svc.kube-ops:9092,kafka-2.kafka-svc.kube-ops:9092
      logstash_format true
      request_timeout    30s
      <buffer>
        @type file
        path /var/log/fluentd-buffers/kubernetes.system.buffer
        flush_mode interval
        retry_type exponential_backoff
        flush_thread_count 2
        flush_interval 5s
        retry_forever
        retry_max_interval 30
        chunk_limit_size 2M
        queue_limit_length 8
        overflow_action block
      </buffer>
      ## data type settings
      <format>
        @type json
      </format>
      ## topic settings
      topic_key topic
      default_topic test
      ## producer settings
      required_acks -1
      compression_codec gzip
    </match>
2
3
4
5
6
7
8
9
10
11
12
13
14
15
16
17
18
19
20
21
22
23
24
25
26
27
28
29
30
31
32
33
34
35
36
37
38
39
40
41
42
43
44
45
46
47
48
49
50
51
52
53
54
55
56
57
58
59
60
61
62
63
64
65
66
67
68
69
70
71
72
73
74
75
76
77
78
79
80
81
82
83
84
85
86
87
88
89
90
91
92
93
94
95
96
97
98
99
100
101
fluentd 的 DS 配置清单:
fluentd-daemonset.yaml
apiVersion: v1
kind: ServiceAccount
metadata:
  name: fluentd-es
  namespace: kube-ops
  labels:
    k8s-app: fluentd-es
    kubernetes.io/cluster-service: "true"
    addonmanager.kubernetes.io/mode: Reconcile
---
kind: ClusterRole
apiVersion: rbac.authorization.k8s.io/v1
metadata:
  name: fluentd-es
  labels:
    k8s-app: fluentd-es
    kubernetes.io/cluster-service: "true"
    addonmanager.kubernetes.io/mode: Reconcile
rules:
  - apiGroups:
      - ""
    resources:
      - "namespaces"
      - "pods"
    verbs:
      - "get"
      - "watch"
      - "list"
---
kind: ClusterRoleBinding
apiVersion: rbac.authorization.k8s.io/v1
metadata:
  name: fluentd-es
  labels:
    k8s-app: fluentd-es
    kubernetes.io/cluster-service: "true"
    addonmanager.kubernetes.io/mode: Reconcile
subjects:
  - kind: ServiceAccount
    name: fluentd-es
    namespace: kube-ops
    apiGroup: ""
roleRef:
  kind: ClusterRole
  name: fluentd-es
  apiGroup: ""
---
apiVersion: apps/v1
kind: DaemonSet
metadata:
  name: fluentd-es
  namespace: kube-ops
  labels:
    k8s-app: fluentd-es
    version: v2.0.4
    kubernetes.io/cluster-service: "true"
    addonmanager.kubernetes.io/mode: Reconcile
spec:
  selector:
    matchLabels:
      k8s-app: fluentd-es
      version: v2.0.4
  template:
    metadata:
      labels:
        k8s-app: fluentd-es
        kubernetes.io/cluster-service: "true"
        version: v2.0.4
      ## This annotation ensures that fluentd does not get evicted if the node
      ## supports critical pod annotation based priority scheme.
      ## Note that this does not guarantee admission on the nodes (#40573).
      annotations:
        scheduler.alpha.kubernetes.io/critical-pod: ""
    spec:
      serviceAccountName: fluentd-es
      containers:
        - name: fluentd-es
          image: registry.cn-hangzhou.aliyuncs.com/rookieops/fluentd-elasticsearch:v2.0.4
          command:
            - "/bin/sh"
            - "-c"
            - "/run.sh $FLUENTD_ARGS"
          env:
            - name: FLUENTD_ARGS
              value: --no-supervisor -q
          resources:
            limits:
              memory: 500Mi
            requests:
              cpu: 100m
              memory: 200Mi
          volumeMounts:
            - name: varlog
              mountPath: /var/log
            - name: varlibdockercontainers
              mountPath: /var/lib/docker/containers
              readOnly: true
            - name: config-volume
              mountPath: /etc/fluent/config.d
      nodeSelector:
        beta.kubernetes.io/fluentd-ds-ready: "true"
      tolerations:
        - key: node-role.kubernetes.io/master
          operator: Exists
          effect: NoSchedule
      terminationGracePeriodSeconds: 30
      volumes:
        - name: varlog
          hostPath:
            path: /var/log
        - name: varlibdockercontainers
          hostPath:
            path: /var/lib/docker/containers
        - name: config-volume
          configMap:
            name: fluentd-config
2
3
4
5
6
7
8
9
10
11
12
13
14
15
16
17
18
19
20
21
22
23
24
25
26
27
28
29
30
31
32
33
34
35
36
37
38
39
40
41
42
43
44
45
46
47
48
49
50
51
52
53
54
55
56
57
58
59
60
61
62
63
64
65
66
67
68
69
70
71
72
73
74
75
76
77
78
79
80
81
82
83
84
85
86
87
88
89
90
91
92
93
94
95
96
97
98
99
100
101
102
103
104
105
106
107
108
109
110
111
112
113
114
115
116
创建配置清单:
## kubectl apply -f fluentd-daemonset.yaml
## kubectl apply -f fluentd-config.yaml
## kubectl get pod -n kube-ops
NAME                             READY   STATUS    RESTARTS   AGE
dingtalk-hook-856c5dbbc9-srcm6   1/1     Running   0          3d17h
fluentd-es-jvhqv                 1/1     Running   0          19m
fluentd-es-s7v6m                 1/1     Running   0          19m
2
3
4
5
6
7
8
