手动搭建 Prometheus
# 在容器外搭建
Prometheus 在容器外搭建非常简单,只需要下载对应的 release,启动二进制文件即可。
下载地址:https://prometheus.io/download/ (opens new window)
然后可以直接用下面命令启动:
./prometheus --config.file=prometheus.yml
其中 prometheus.yaml 是主要的配置文件,主要配置信息如下:
global:
  scrape_interval: 15s
  evaluation_interval: 15s

rule_files:
  ## - "first.rules"
  ## - "second.rules"

scrape_configs:
  - job_name: prometheus
    static_configs:
      - targets: ["localhost:9090"]
2
3
4
5
6
7
8
9
10
11
12
上面配置信息主要包括三个模块:global,rule_files,scrape_configs。
(1)、global 定义 Prometheus server 全局配置。
- scrape_interval,定义采集频率
- evaluation_interval,定义评估规则的频率,Prometheus 使用规则产生的时间序列数据或者产生的警报
(2)、rule_file,用于指定规则,Prometheus 使用规则产生的时间序列数据或者产生的警报
(3)、scrape_configs,用于控制监控的资源
Prometheus 默认会通过/metrics 路径采集 metrics,比如:curl http://localhost:9090/metrics 就可以看到相应的资源对象了。
# 在容器内搭建
1、创建 namespace:
## kubectl create ns kube-ops
2、创建 configmap,保存我们的主配置文件 prometheus.yaml,这样我们要更新配置文件的话就只需要更新这个 configmap 即可。
prom-configmap.yaml
apiVersion: v1
kind: ConfigMap
metadata:
  name: prometheus-config
  namespace: kube-ops
data:
  prometheus.yaml: |
    global:
      scrape_interval: 15s
      scrape_timeout: 15s
    scrape_configs:
    - job_name: 'prometheus'
      static_configs:
      - targets: ['localhost:9090']
2
3
4
5
6
7
8
9
10
11
12
13
14
创建资源:
## kubectl apply -f prom-configmap.yaml
configmap/prometheus-config created
## kubectl get configmap -n kube-ops
NAME                DATA   AGE
prometheus-config   1      16s
2
3
4
5
(3)、创建 prometheus 的 Pod
prom-deploy.yaml
apiVersion: extensions/v1beta1
kind: Deployment
metadata:
  name: prometheus-deploy
  namespace: kube-ops
  labels:
    app: prometheus
spec:
  selector:
    matchLabels:
      app: prometheus
  replicas: 1
  template:
    metadata:
      labels:
        app: prometheus
    spec:
      serviceAccountName: prometheus-sa
      containers:
        - name: prometheus
          image: prom/prometheus:v2.14.0
          imagePullPolicy: IfNotPresent
          command:
            - "/bin/prometheus"
          args:
            - "--config.file=/etc/prometheus/prometheus.yaml"
            - "--storage.tsdb.path=/data/prometheus"
            - "--storage.tsdb.retention=24h"
            - "--web.enable-admin-api"
            - "--web.enable-lifecycle"
          ports:
            - name: http
              protocol: TCP
              containerPort: 9090
          volumeMounts:
            - name: data
              mountPath: "/data/prometheus"
              subPath: prometheus
            - name: prometheus-config
              mountPath: "/etc/prometheus"
          resources:
            requests:
              cpu: 100m
              memory: 500Mi
            limits:
              cpu: 100m
              memory: 500Mi
      securityContext:
        runAsUser: 0
      volumes:
        - name: data
          persistentVolumeClaim:
            claimName: prometheus
        - name: prometheus-config
          configMap:
            name: prometheus-config
2
3
4
5
6
7
8
9
10
11
12
13
14
15
16
17
18
19
20
21
22
23
24
25
26
27
28
29
30
31
32
33
34
35
36
37
38
39
40
41
42
43
44
45
46
47
48
49
50
51
52
53
54
55
56
我们把上面定义的 configMap 通过挂载的形式挂载到容器中,然后我们还要定义一个持久化 PVC。
(4)、创建 PV,PVC
prom-pvc.yaml
---
apiVersion: v1
kind: PersistentVolume
metadata:
  name: prometheus-pv
spec:
  capacity:
    storage: 10Gi
  accessModes:
    - ReadWriteOnce
  persistentVolumeReclaimPolicy: Recycle
  nfs:
    server: xx.xx.xx.xx
    path: /data/k8s/prometheus
---
apiVersion: v1
kind: PersistentVolumeClaim
metadata:
  name: prometheus
  namespace: kube-ops
spec:
  accessModes:
    - ReadWriteOnce
  resources:
    requests:
      storage: 10Gi
2
3
4
5
6
7
8
9
10
11
12
13
14
15
16
17
18
19
20
21
22
23
24
25
26
(5)、配置 RBAC 认证
我们在 deploy 的模板中定义了 serviceAccount,我们就需要定义一个 serviceAccount 的 RBAC。
prom-rbac.yaml
---
apiVersion: v1
kind: ServiceAccount
metadata:
  name: prometheus-sa
  namespace: kube-ops
---
apiVersion: rbac.authorization.k8s.io/v1
kind: ClusterRole
metadata:
  name: prometheus
rules:
  - apiGroups:
      - ""
    resources:
      - nodes
      - services
      - endpoints
      - pods
      - nodes/proxy
    verbs:
      - get
      - list
      - watch
  - apiGroups:
      - ""
    resources:
      - configmaps
      - nodes/metrics
    verbs:
      - get
  - nonResourceURLs:
      - /metrics
    verbs:
      - get
---
apiVersion: rbac.authorization.k8s.io/v1
kind: ClusterRoleBinding
metadata:
  name: prometheus
roleRef:
  apiGroup: rbac.authorization.k8s.io
  kind: ClusterRole
  name: prometheus
subjects:
  - kind: ServiceAccount
    name: prometheus-sa
    namespace: kube-ops
2
3
4
5
6
7
8
9
10
11
12
13
14
15
16
17
18
19
20
21
22
23
24
25
26
27
28
29
30
31
32
33
34
35
36
37
38
39
40
41
42
43
44
45
46
47
48
(6)、创建 Service,用来暴露 promethes 服务
prom-service.yaml
apiVersion: v1
kind: Service
metadata:
  name: prometheus-svc
  namespace: kube-ops
spec:
  type: NodePort
  selector:
    app: prometheus
  ports:
    - name: prometheus-web
      port: 9090
      targetPort: http
2
3
4
5
6
7
8
9
10
11
12
13
(7)、创建配置清单
创建 PVC
## kubectl apply -f prom-pvc.yaml
persistentvolume/prometheus-pv created
persistentvolumeclaim/prometheus created
## kubectl get pv -n kube-ops
NAME            CAPACITY   ACCESS MODES   RECLAIM POLICY   STATUS   CLAIM                 STORAGECLASS   REASON   AGE
prometheus-pv   10Gi       RWO            Recycle          Bound    kube-ops/prometheus                           7s
## kubectl get pvc -n kube-ops
NAME         STATUS   VOLUME          CAPACITY   ACCESS MODES   STORAGECLASS   AGE
prometheus   Bound    prometheus-pv   10Gi       RWO                           13s
2
3
4
5
6
7
8
9
创建 RBAC
## kubectl apply -f prom-rbac.yaml
serviceaccount/prometheus-sa created
clusterrole.rbac.authorization.k8s.io/prometheus created
clusterrolebinding.rbac.authorization.k8s.io/prometheus created
## kubectl get clusterrole -n kube-ops | grep prometheus
prometheus                                                             35s
## kubectl get clusterrolebinding -n kube-ops | grep prometheus
prometheus                                             46s
2
3
4
5
6
7
8
创建 Pod
## kubectl apply -f prom-deploy.yaml
deployment.extensions/prometheus-deploy created
## kubectl get deploy -n kube-ops
NAME                READY   UP-TO-DATE   AVAILABLE   AGE
prometheus-deploy   1/1     1            0           10s
## kubectl get pod -n kube-ops
NAME                                 READY   STATUS    RESTARTS   AGE
prometheus-deploy-694446b7cb-ssdqm   1/1     Running   0          18s
2
3
4
5
6
7
8
创建 Service
## kubectl apply -f prom-service.yaml
service/prometheus-svc created
## kubectl get svc -n kube-ops
NAME             TYPE       CLUSTER-IP     EXTERNAL-IP   PORT(S)          AGE
prometheus-svc   NodePort   10.68.254.74   <none>        9090:23050/TCP   6
2
3
4
5
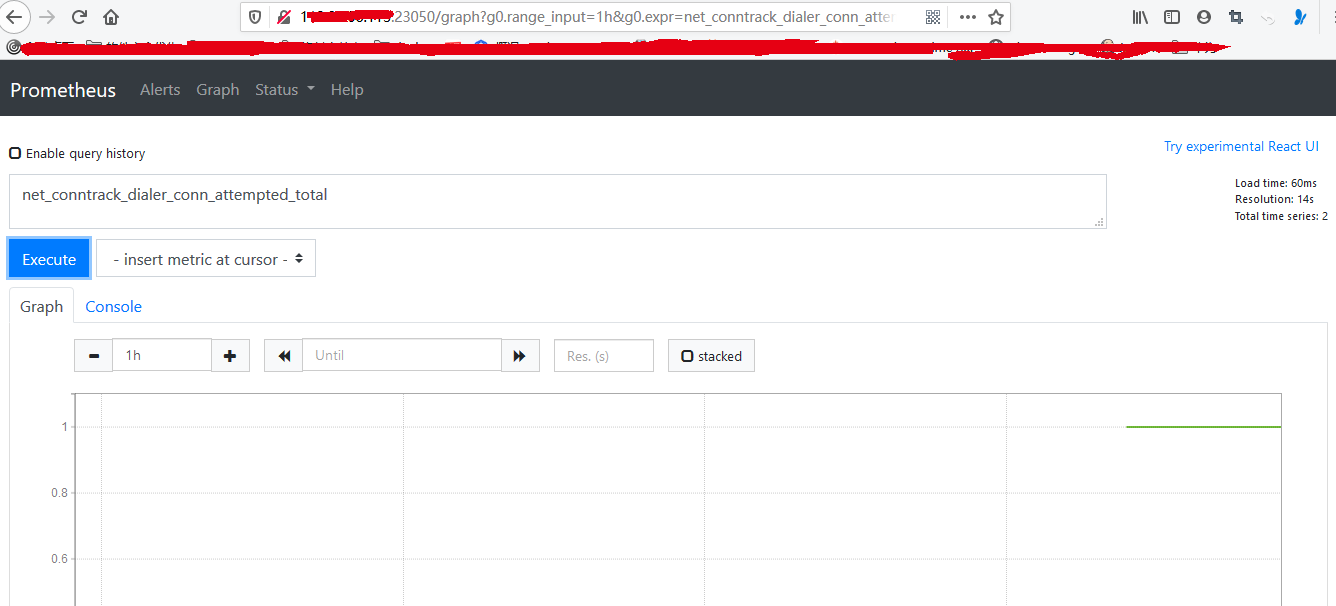
然后就可以通过浏览器访问 WEB 界面了